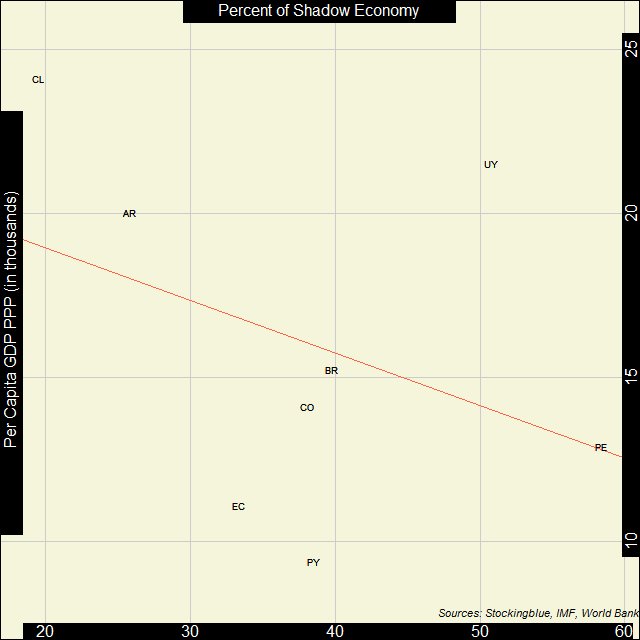
In South America, the correlation between economic strength and the strength of the shadow economy is pretty weak. Every country studied on the continent, excluding Chile, has a shadow economy that takes up at least one-fifth of its overall economy.
Findings
- The correlation coefficient between per capita Gross Domestic Product (GDP) in Purchasing Power Parity (PPP) and shadow economies in North America is -0.38.
- Still, as economic strength increases in South America, the shadow economy somewhat decreases.
- Chile has the smallest shadow economy and the largest per capita GDP PPP of the South American nations studied by the Global Foundation for Integrity (GFI).
- Peru had the largest shadow economy of the North American nations studied by GFI.
- Paraguay had the smallest per capita GDP PPP of the North American nations studied by GFI.
- Uruguay and Peru are the only South American countries whose shadow economy takes up over half of the economy as a whole.
Caveats
- As always, correlation does not imply causation.
- Bolivia, French Guiana, Guyana, Suriname, and Venezuela were missing data.
- The GDP data is from 2016 while the shadow economy data is the average from 1999-2006.
Details
Just as in North America, the largest economy (Chile) also has the smallest proportions of shadow activity. However, Uruguay, which happens to be the second largest also boasts the second highest percentage of shadow activity.
Argentina which boasts the third largest GDP PPP has the second lowest proportion of shadow business activity.
All countries in South America, except for Chile, have shadow economies that take up over one-quarter of the overall economy, and all except for Chile and Argentina have shadow economies that take up at least one-third of their overall economy. Uruguay and Peru have less than half of their economic activity in legitimate transactions.
Country Codes
| Code | Country |
|---|---|
| AR | Argentina |
| BR | Brazil |
| CL | Chile |
| CO | Colombia |
| EC | Ecuador |
| PE | Peru |
| PY | Paraguay |
| UY | Uruguay |
Sources
Schneider, Friedrich, Andreas Buehn, and Claudio E. Montenegro. 2010. "Shadow Economies All over the World: New Estimates for 162 Countries from 1999 to 2007." The World Bank Development Research Group.