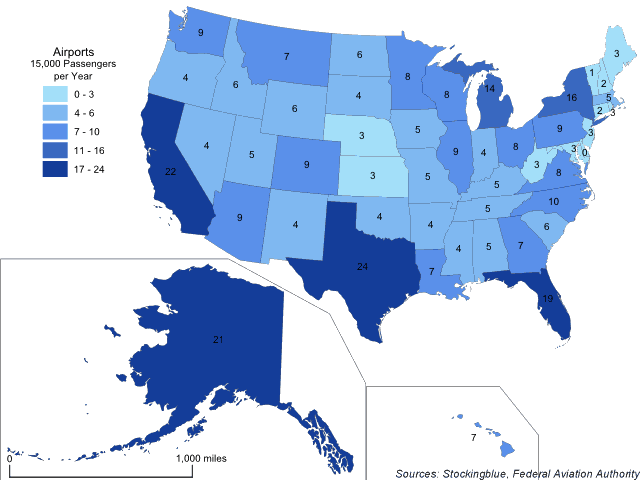
The map above shows the number of airports in each US state that serve at least 15,000 passengers per year. Texas leads all other US states and beats California by a slim margin.
Findings
- Texas has the most airports in the US that serve at least 15,000 passengers annually at 24.
- Delaware has the least at none. Of the states that do have a busy airport Vermont has the least with one.
- New York and Florida have considerably smaller areas than several Western states but have many more busy airports.
- The median number of busy airports in the US is 5, the mean 6.96.
Caveats
- The data is from 2017.
- The map is presented in an Albers equal-area conic projection.
- The choropleth classification is based on Jenks or natural breaks.
Details
Even though Alaska has one of the smallest populations in the US, it still has a lot of busy airports, likely due to the fact that the road network is very limited in the state and bush planes make up a large part of the state's transportation. Delaware has not had a busy airport since the last major commercial airliner stopped flying to Wilmington in 2015.
Texas, California, Alaska, Florida, and New York make up one-quarter of the nation's busy airports. Thirteen states make up half of the busy airports in the US: Texas, California, Alaska, Florida, New York, Michigan, North Carolina, Arizona, Colorado, Illinois, Pennsylvania, Washington, and any of Minnesota, Ohio, Virginia, or Wisconsin. Adding another thirteen states and the leading 26 states makes up three-quarters of the country's busy airports.
Data
| State | Airports (>15,000 Passengers) |
|---|---|
| Alabama | 5 |
| Alaska | 21 |
| Arizona | 9 |
| Arkansas | 4 |
| California | 22 |
| Colorado | 9 |
| Connecticut | 2 |
| Delaware | 0 |
| Florida | 19 |
| Georgia | 7 |
| Hawaii | 7 |
| Idaho | 6 |
| Illinois | 9 |
| Indiana | 4 |
| Iowa | 5 |
| Kansas | 3 |
| Kentucky | 5 |
| Louisiana | 7 |
| Maine | 3 |
| Maryland | 3 |
| Massachusetts | 5 |
| Michigan | 14 |
| Minnesota | 8 |
| Mississippi | 4 |
| Missouri | 5 |
| Montana | 7 |
| Nebraska | 3 |
| Nevada | 4 |
| New Hampshire | 2 |
| New Jersey | 3 |
| New Mexico | 4 |
| New York | 16 |
| North Carolina | 10 |
| North Dakota | 6 |
| Ohio | 8 |
| Oklahoma | 4 |
| Oregon | 4 |
| Pennsylvania | 9 |
| Rhode Island | 3 |
| South Carolina | 6 |
| South Dakota | 4 |
| Tennessee | 5 |
| Texas | 24 |
| Utah | 5 |
| Vermont | 1 |
| Virginia | 8 |
| Washington | 9 |
| West Virginia | 3 |
| Wisconsin | 8 |
| Wyoming | 6 |
Sources
Federal Aviation Authority. 2018. "Enplanements of All Commercial Service Airports (by Rank)." Accessed November 26, 2018. https://www.faa.gov/airports/planning_capacity/passenger_allcargo_stats/passenger/media/cy17-commercial-service-enplanements.pdf.