EU and US Regional Unemployment Rates, May 2021
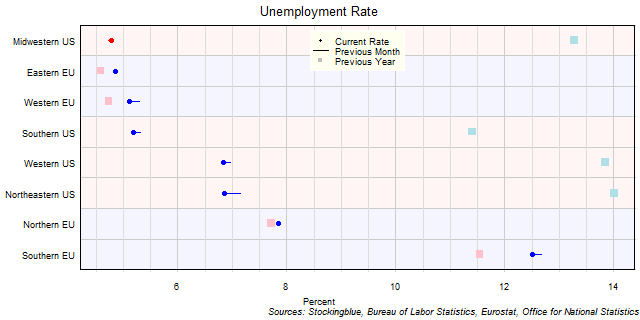
The chart above shows the unemployment rate in each EU and US region as of May 2021 (unless otherwise noted - see caveats below), the change from the previous month, and the rate one year prior. The Midwestern US was the only region to see a rise in the unemployment rate over the previous month.
EU Regional Unemployment Rates, May 2021

The chart above shows the unemployment rate in each EU region as of May 2021 (unless otherwise noted - see caveats below), the change from the previous month, and the rate one year prior. All four regions saw a drop in their rate over the previous month.
EU and US Unemployment Rates, May 2021
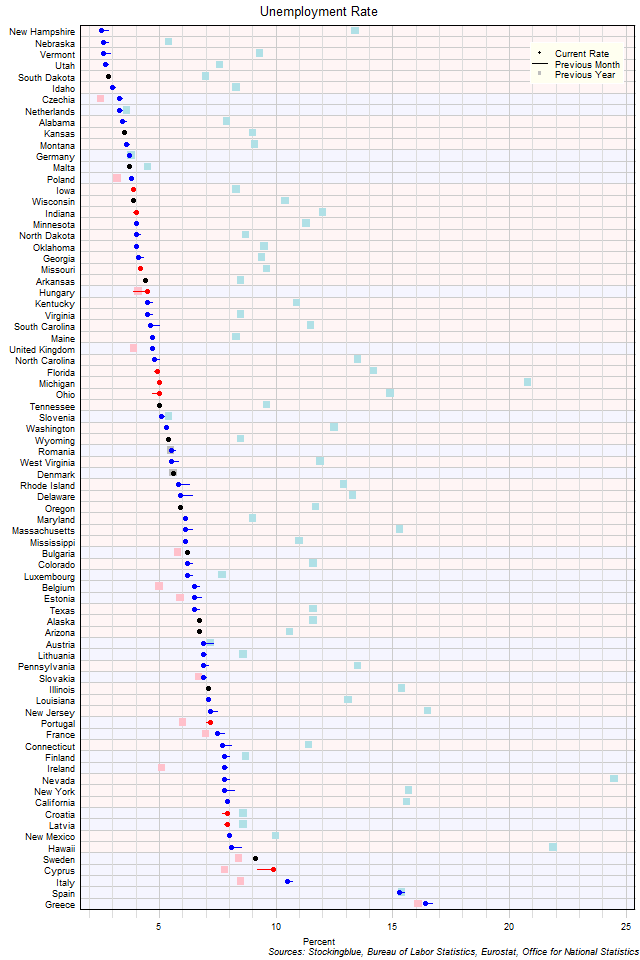
The chart above shows the unemployment rate in each EU and US state as of May 2021 (unless otherwise noted - see caveats below), the change from the previous month, and the rate one year prior. Nebraska, New Hampshire, South Dakota, Utah, and Vermont are the only states with a rate below three percent.
EU Unemployment Rates, May 2021
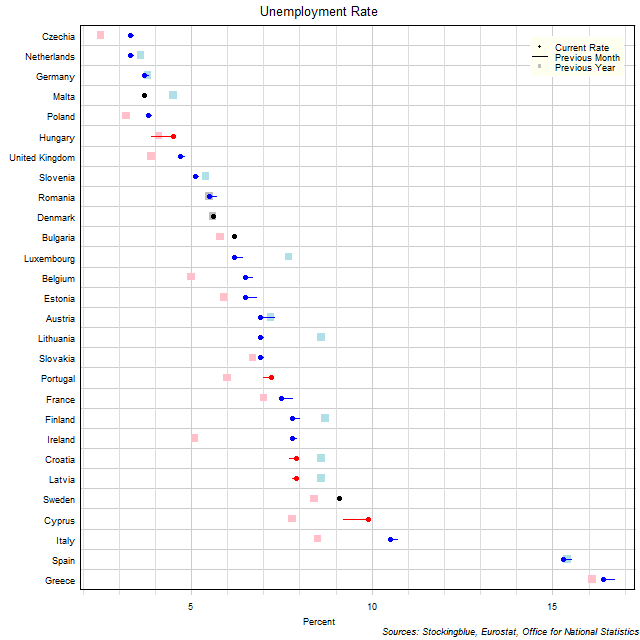
The chart above shows the unemployment rate in each EU state as of May 2021 (unless otherwise noted - see caveats below), the change from the previous month, and the rate one year prior. There are no states with an unemployment rate below three percent.
EU Long-Term Interest Rates, May 2021
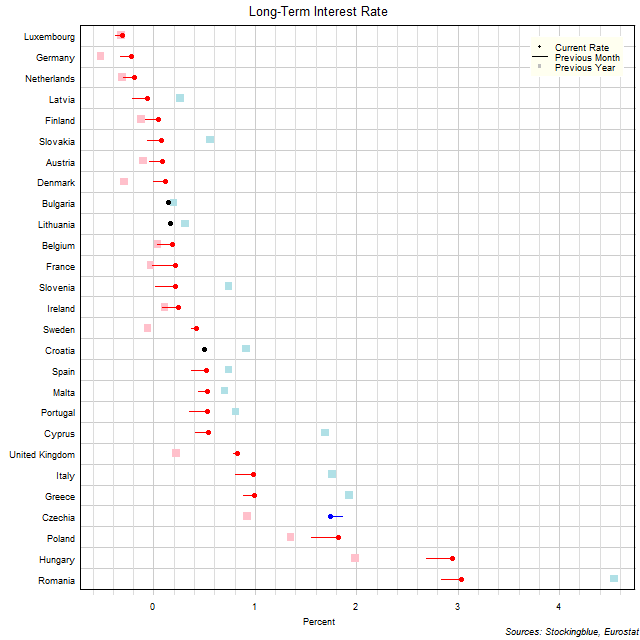
The chart above shows the ten-year interest rate in each EU state as of May 2021, the change from the previous month, and the rate one year prior. Four states have a negative interest rate (down from 8 last month and down from 8 last year).
EU and US Cities by Population Density of Urban Area
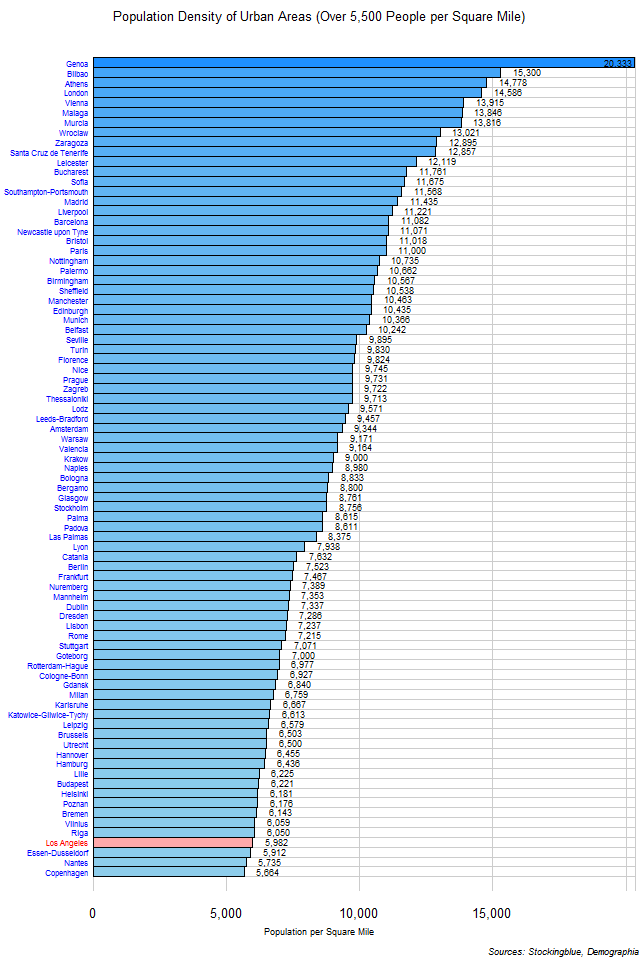
The chart above shows the population density of each urban area with a population of over 500,000 with a population density over 5,500 people per square mile (2,124 people per square kilometer) while the chart below shows all urban areas with a population of over 500,000 with a population density under 5,500 people per square mile. The urban areas have been normalized so as to avoid any inconsistencies with how cities and their metropolitan areas are defined by their governments. Each urban area has similar characteristics making this the definitive method with which to compare cities across various countries. Most large EU cities have a population density over 5,500 people per square mile and populate the above chart while most US cities have a population density under 5,500 people per square mile and thus populate the chart below.
EU Cities by Population Density of Urban Area
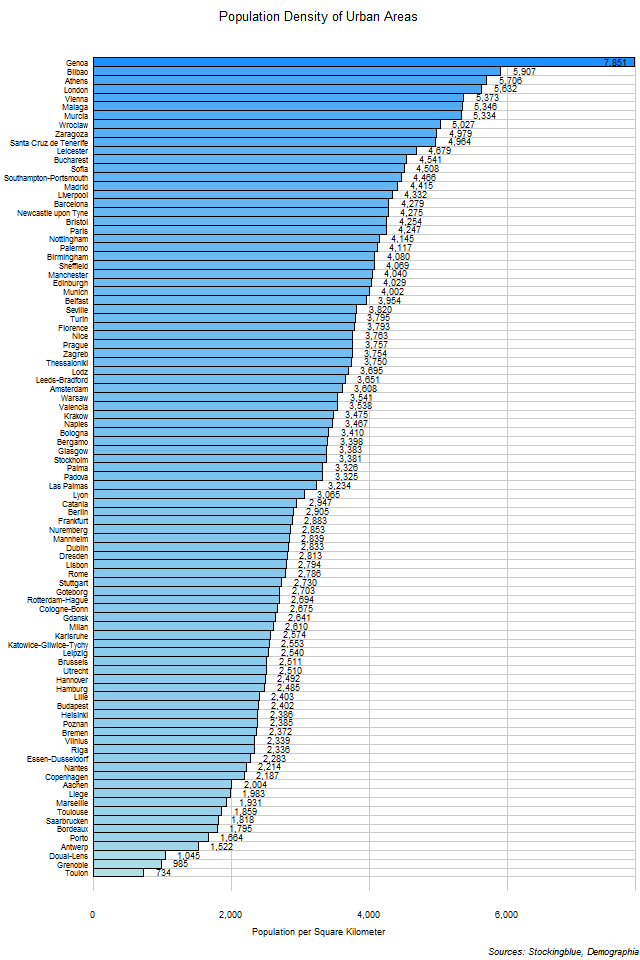
The chart above shows the population density of each urban area with a population of over 500,000. The urban areas have been normalized so as to avoid any inconsistencies with how cities and their metropolitan areas are defined by their governments. Each urban area has similar characteristics making this the definitive method with which to compare cities across various countries. Genoa has the largest population density by far in the EU.
EU and US Regional Unemployment Rates, April 2021
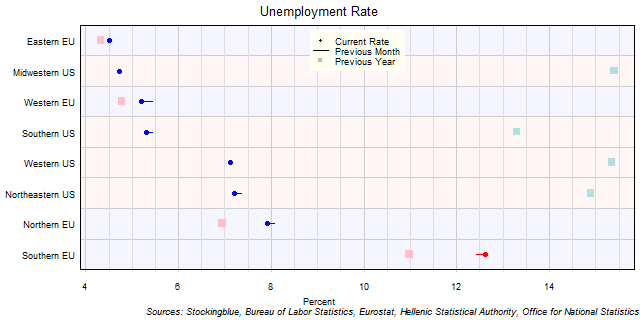
The chart above shows the unemployment rate in each EU and US region as of April 2021 (unless otherwise noted - see caveats below), the change from the previous month, and the rate one year prior. The Southern EU was the only region to see a rise in the unemployment rate over the previous month.
EU Regional Unemployment Rates, April 2021

The chart above shows the unemployment rate in each EU region as of April 2021 (unless otherwise noted - see caveats below), the change from the previous month, and the rate one year prior. The Southern EU was the only region to see a rise in the unemployment rate over the previous month.
EU and US Unemployment Rates, April 2021
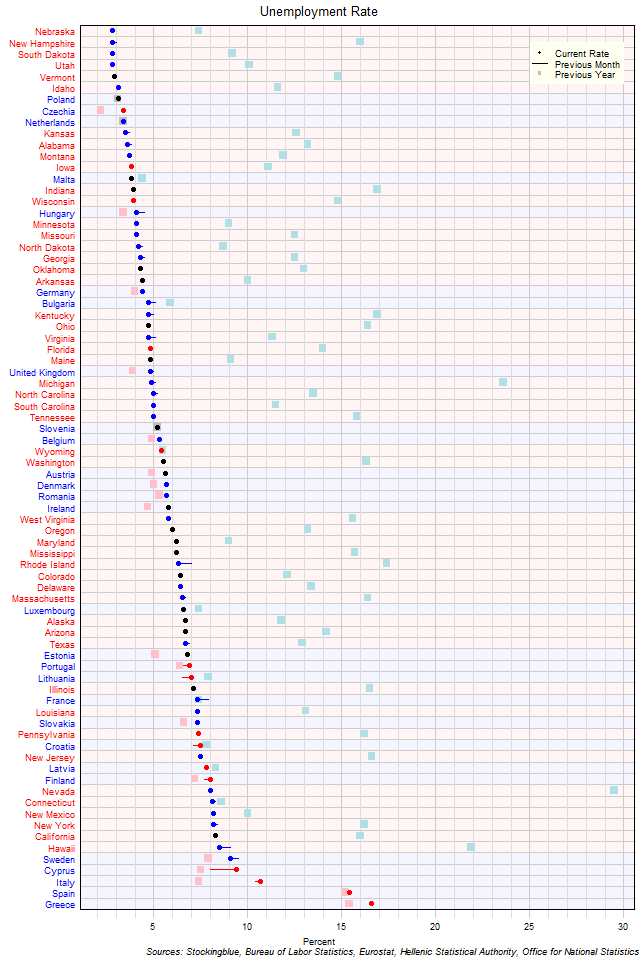
The chart above shows the unemployment rate in each EU and US state as of April 2021 (unless otherwise noted - see caveats below), the change from the previous month, and the rate one year prior. Nebraska, New Hampshire, South Dakota, Utah, and Vermont are the only states with a rate below three percent.
OlderNewer