Long-Term EU and US GDP Growth Rate by State, Third Quarter 2019
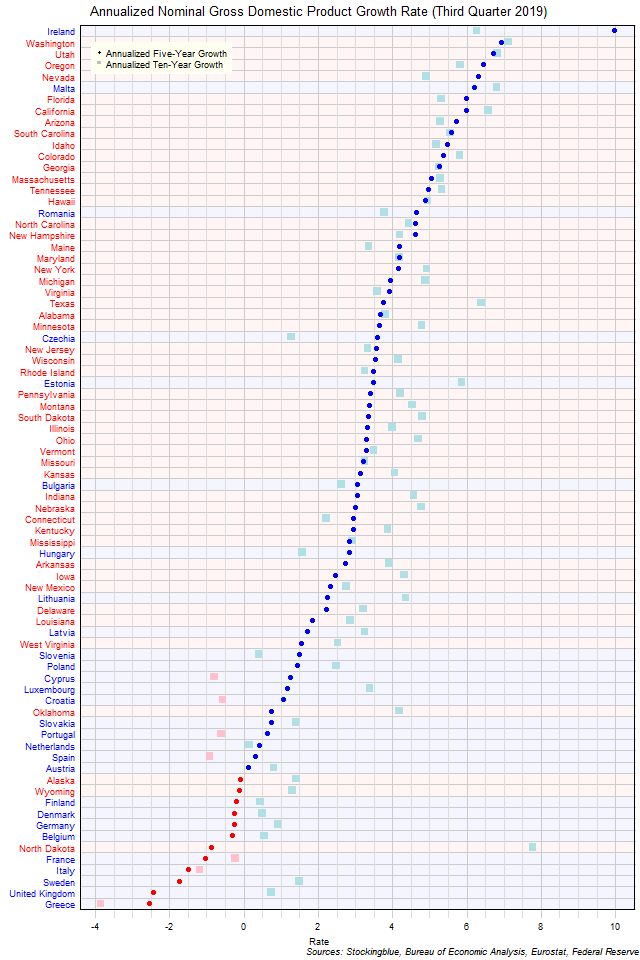
The chart above shows the annualized nominal gross domestic product (GDP) growth rate when the GDP is priced in US dollars in each EU and US state over the past five years as of the third quarter of 2019 and the growth rate over the past ten years. Only EU states saw a contraction both over the past five and ten years.
Long-Term EU GDP Growth Rate by State, Third Quarter 2019
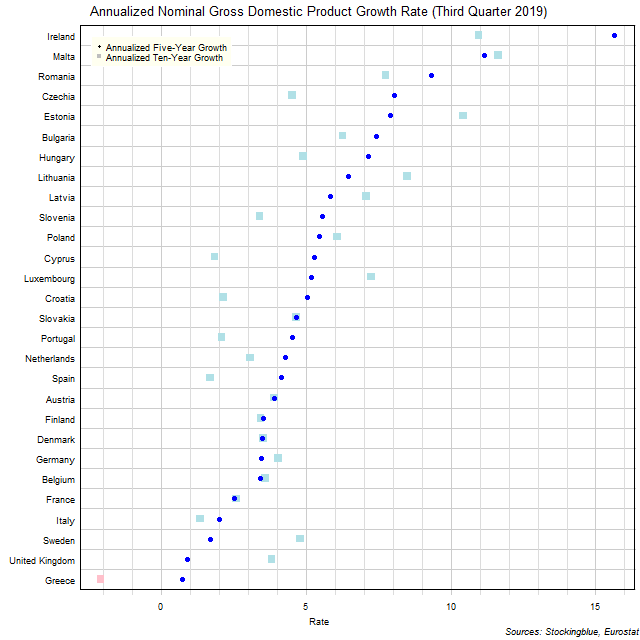
The chart above shows the annualized nominal gross domestic product (GDP) growth rate in each EU state over the past five years as of the third quarter of 2019 and the growth rate over the past ten years. Greece is the only state to experience negative growth over either period.
Long-Term Per Capita GDP by EU and US Region, Third Quarter 2019
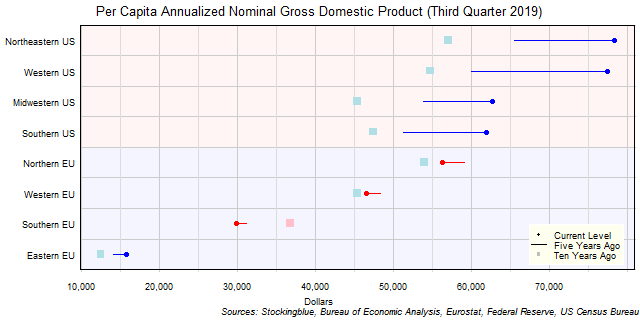
The chart above shows the per capita annualized nominal gross domestic product (GDP) in each EU and US region as of the third quarter of 2019 in US dollars, the change from five years ago, and the per capita GDP ten years prior. US regions have had a very good past five years.
Long-Term Per Capita GDP by EU Region, Third Quarter 2019

The chart above shows the per capita annualized nominal gross domestic product (GDP) in each EU region as of the third quarter of 2019 in euros, the change from five years ago, and the per capita GDP ten years prior. Every single region's economy grew both over the past five and past ten years.
Long-Term Per Capita GDP by EU and US State, Third Quarter 2019
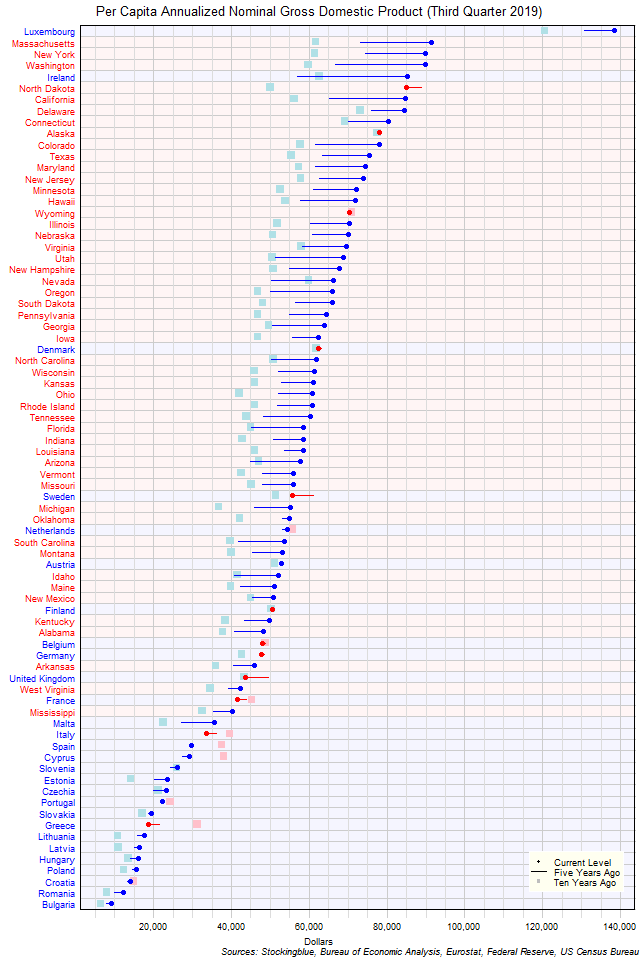
The chart above shows the per capita annualized nominal gross domestic product (GDP) in each EU and US state as of the third quarter of 2019 in dollars, the change from five years ago, and the GDP ten years prior. Currency rate fluctuations have not been kind to EU states over the past five years as most US states' per capita GDP zoomed past the per capita GDP of most EU states.
Long-Term Per Capita GDP by EU State, Third Quarter 2019
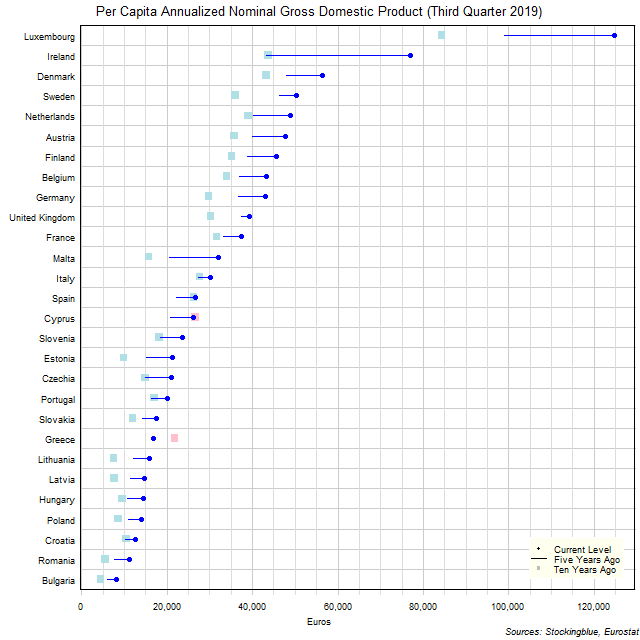
The chart above shows the per capita annualized nominal gross domestic product (GDP) in each EU state as of the third quarter of 2019 in euros, the change from five years ago, and the per capita GDP ten years prior. Luxembourg and Ireland had exceptional growth over the past five years.
EU and US Regional Unemployment Rates, January 2020
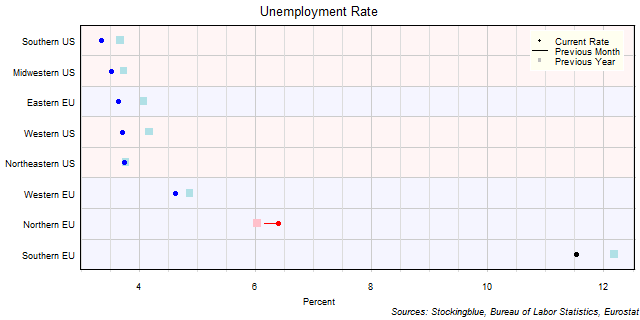
The chart above shows the unemployment rate in each EU and US region as of January 2020 (unless otherwise noted - see caveats below), the change from the previous month, and the rate one year prior. US regions continue to have considerably lower unemployment rates than EU regions with the Eastern EU being the only EU region that tops US regions.
EU Regional Unemployment Rates, January 2020

The chart above shows the unemployment rate in each EU region as of January 2020 (unless otherwise noted - see caveats below), the change from the previous month, and the rate one year prior. The Northern EU is the only region with an unemployment rate higher than the previous month and higher than the previous year.
EU and US Unemployment Rates, January 2020
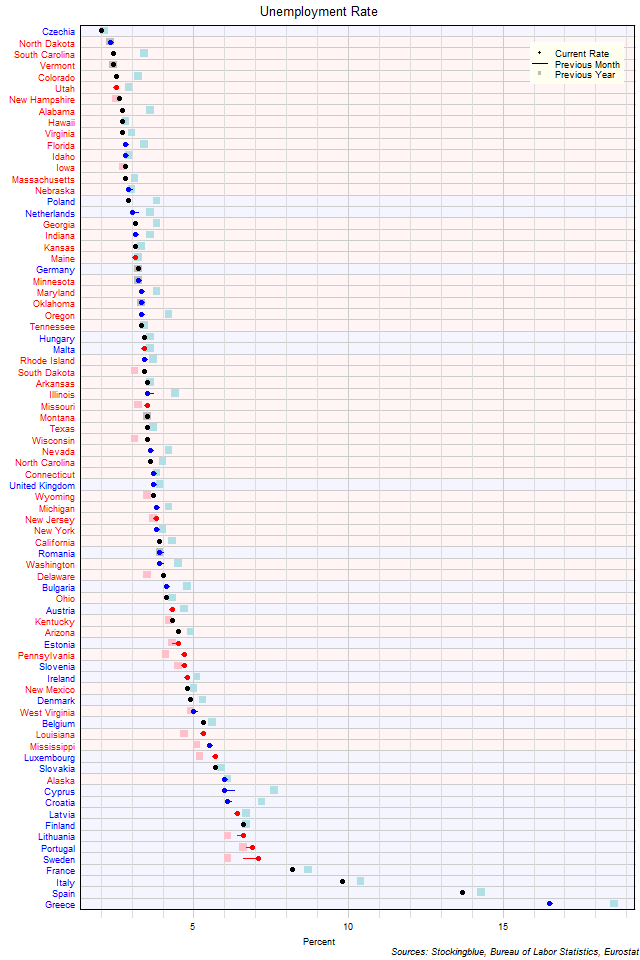
The chart above shows the unemployment rate in each EU and US state as of January 2020 (unless otherwise noted - see caveats below), the change from the previous month, and the rate one year prior. Czechia and Poland are the only EU states with an unemployment rate below three percent. Fourteen US states have a rate below three percent.
Long-Term GDP by EU and US Region, Third Quarter 2019
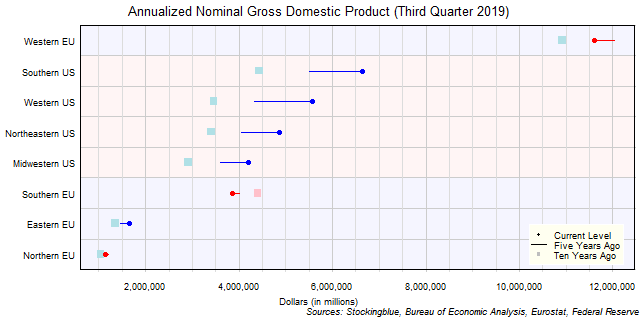
The chart above shows the annualized nominal gross domestic product (GDP) in each EU and US region as of the third quarter of 2019 in millions of US dollars, the change from five years ago, and the GDP ten years prior. The Western US grew by more over the past five years than the entire GDP of the Northern EU. Additionally, all four US regions each had an improvement in their GDP over the past ten years that is larger than the entire GDP of the Northern EU and the Southern and Western US also grew by more in the period than the entire GDP of the Eastern EU.
OlderNewer