EU Long-Term Interest Rates, April 2020
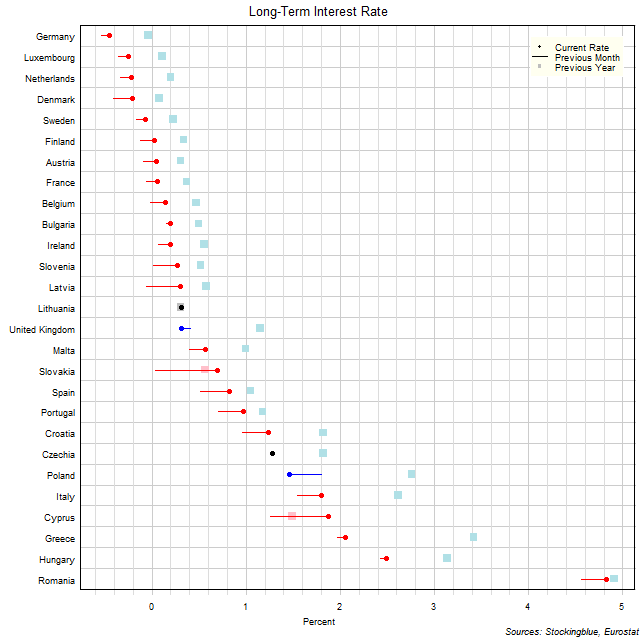
The chart above shows the ten-year interest rate in each EU state as of April 2020, the change from the previous month, and the rate one year prior. Five states have a negative interest rate (down from ten last month and up from one last year).
Treasury Rate Movements, May 2020
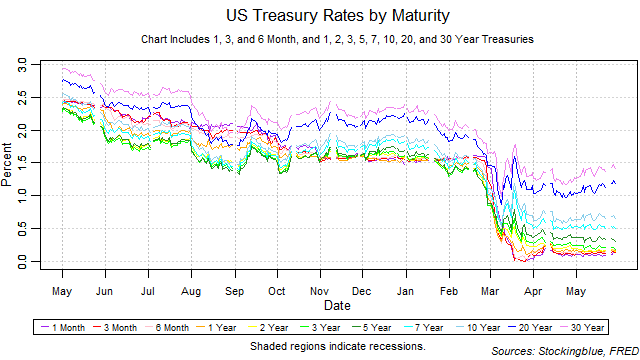
All rates except for the two, three, five, and seven-year notes rose in May. The yield curve widened from the previous month thus ending its narrowing streak of one month. The one-month bill maintained the lowest rate throughout the month. Long-term and short-term rates rose while medium-term rates rose thus decreasing the risk of an inversion brought upon by rising short-term rates. Such an inversion, if it were to happen would be a strong indicator for an upcoming recession.
EU Long-Term Interest Rates, March 2020
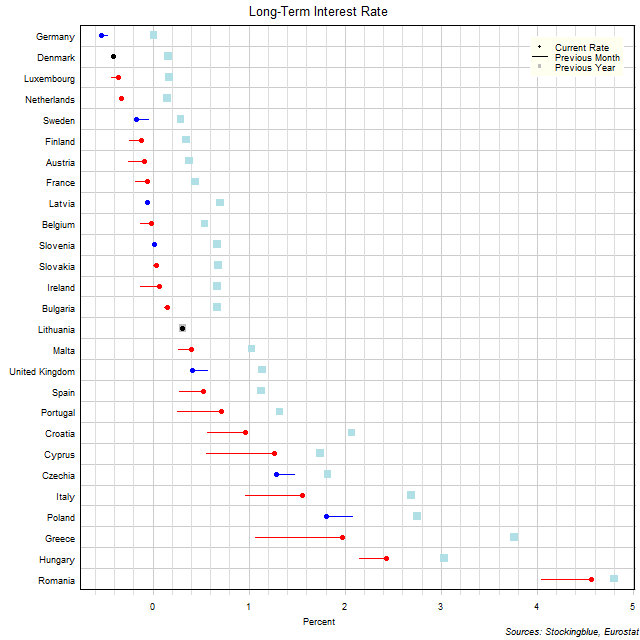
The chart above shows the ten-year interest rate in each EU state as of March 2020, the change from the previous month, and the rate one year prior. Ten states have a negative interest rate (down from eleven last month and up from zero last year).
Treasury Rate Movements, April 2020
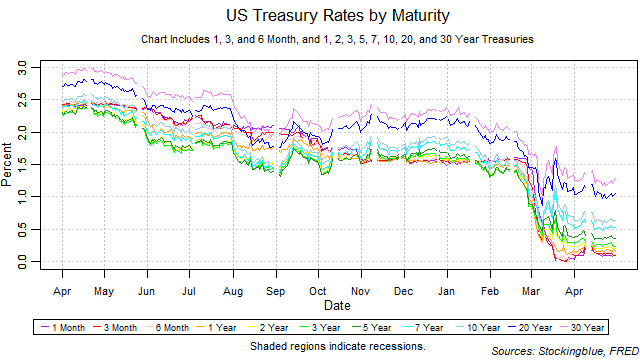
All rates except for the one-month bill fell in April. The yield curve narrowed from the previous month thus ending its widening streak. The one-month bill did not maintain the lowest rate throughout the month. Long-term rates fell while short-term rates rose thus increasing the risk of an inversion brought upon by rising short-term rates. Such an inversion, if it were to happen would be a strong indicator for an upcoming recession.
EU Long-Term Interest Rates, February 2020
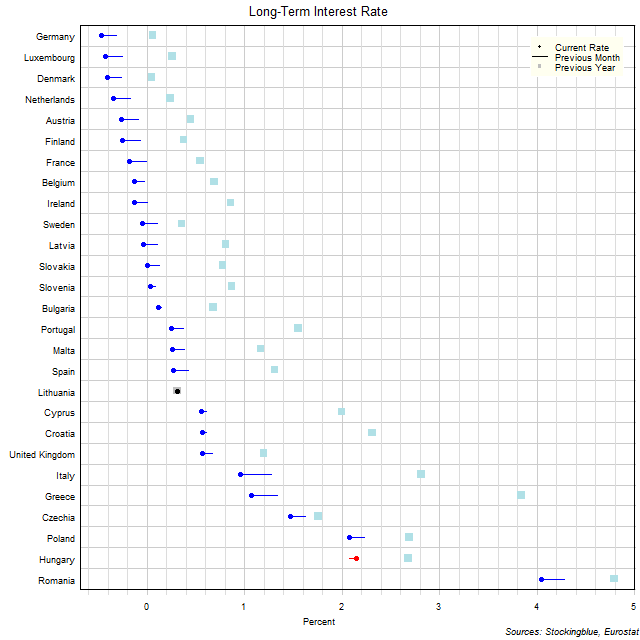
The chart above shows the ten-year interest rate in each EU state as of February 2020, the change from the previous month, and the rate one year prior. Eleven states have a negative interest rate (up from eight last month and up from zero last year).
Treasury Rate Movements, March 2020
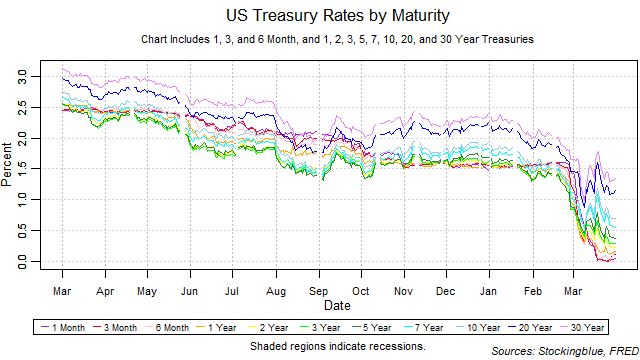
All rates fell in March. The yield curve widened from the previous month thus extending its widening streak to two months. The one-month bill did not maintain the lowest rate throughout the month. All rates fell thus decreasing the risk of an inversion brought upon by rising short-term rates. Such an inversion, if it were to happen would be a strong indicator for an upcoming recession.
EU Long-Term Interest Rates, January 2020
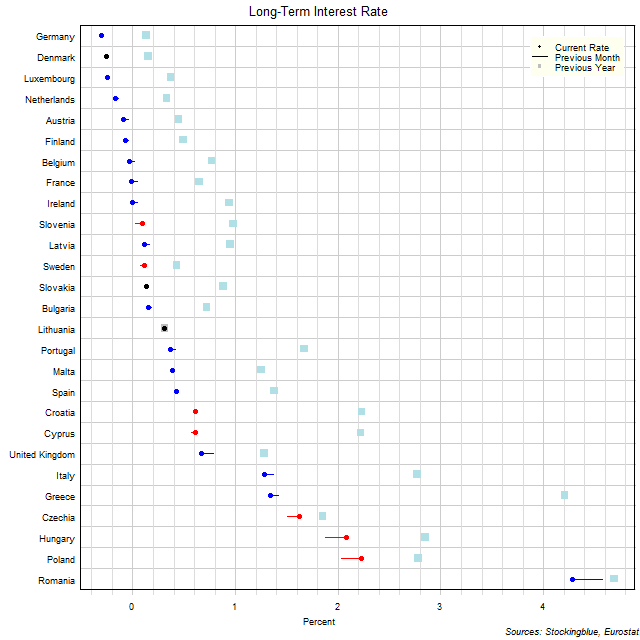
The chart above shows the ten-year interest rate in each EU state as of January 2020, the change from the previous month, and the rate one year prior. Eight states have a negative interest rate (up from six last month and up from zero last year).
Treasury Rate Movements, February 2020
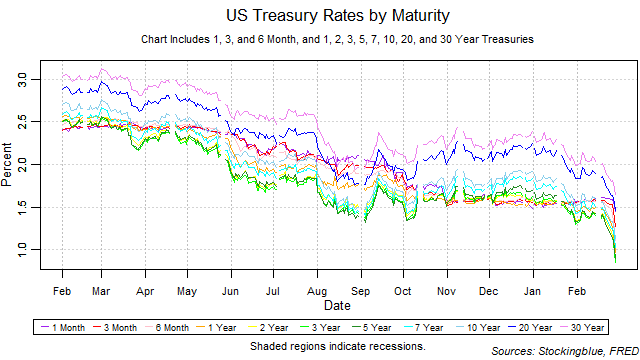
All rates fell in February. The yield curve widened from the previous month thus ending its narrowing streak of one month. The one-month bill did not maintain the lowest rate at any point during the month. All rates fell thus decreasing the risk of an inversion brought upon by rising short-term rates. Such an inversion, if it were to happen would be a strong indicator for an upcoming recession.
EU Long-Term Interest Rates, December 2019
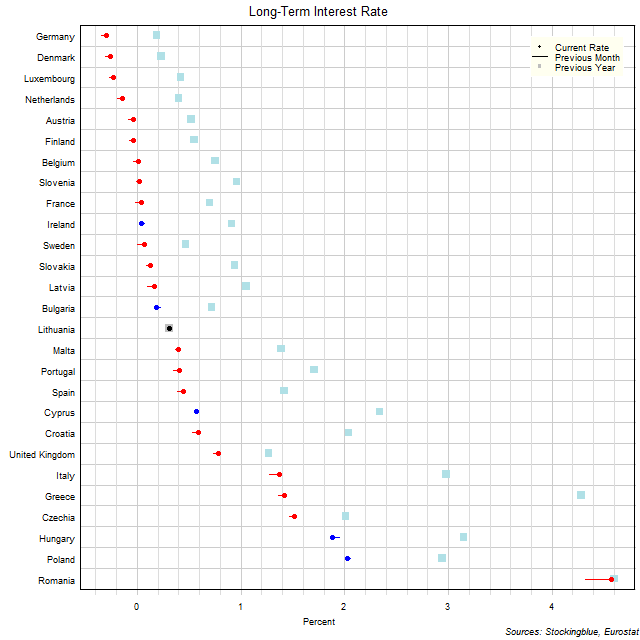
The chart above shows the ten-year interest rate in each EU state as of December 2019, the change from the previous month, and the rate one year prior. Six states have a negative interest rate (down from nine last month and up from zero last year).
Treasury Rate Movements, January 2020
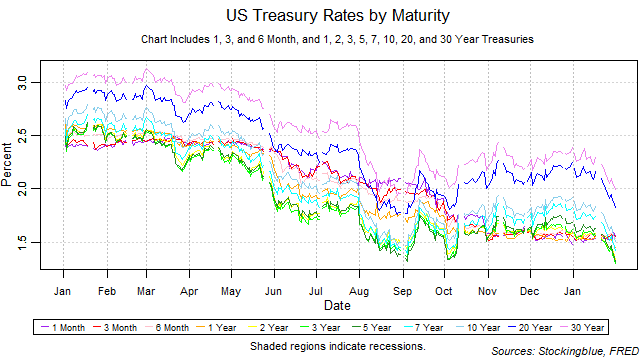
The one-month rate fell in January, the three-month remained unchanged, while all other rates rose. The yield curve narrowed from the previous month thus ending its widening streak of one month. The one-month bill did not maintain the lowest rate throughout the month. Long-term rates fell while short-term rates rose thus increasing the risk of an inversion brought upon by rising short-term rates. Such an inversion, if it were to happen would be a strong indicator for an upcoming recession.
OlderNewer