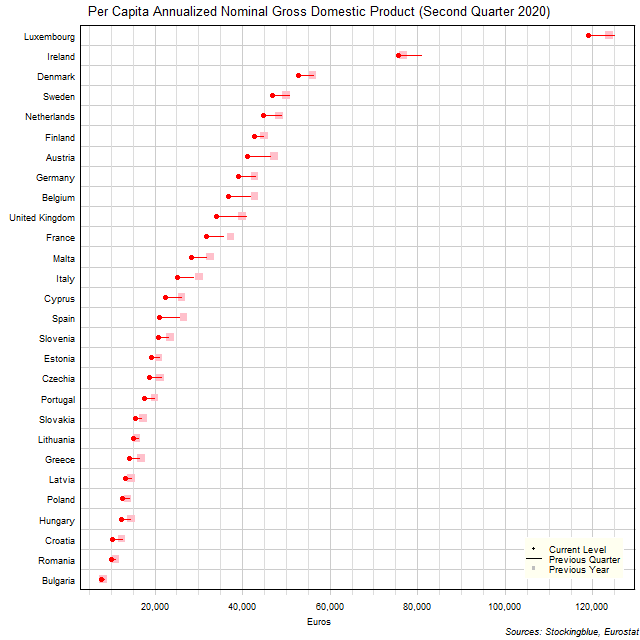
The chart above shows the per capita annualized nominal gross domestic product (GDP) in each EU state as of the second quarter of 2020 in euros, the change from the previous quarter, and the GDP one year prior. Every single state's economy contracted over the past quarter and the past year.
Findings
- The difference between the state with the largest per capita GDP, Luxembourg, and the state with the smallest, Bulgaria, is €111,299.23 (down from €116,494.91 last quarter and down from €115,539.22 last year). Luxembourg and Bulgaria had the largest and smallest per capita GDP respectively both last quarter and last year.
- Luxembourg has 15.47 times the per capita GDP that Bulgaria does. The ratio of largest per capita GDP to smallest per capita GDP was up from 14.84 last quarter and up from 14.98 last year.
- The median per capita GDP in the 28 EU states is €21,715.60 (down from €25,819.75 last quarter and down from €26,354.58 last year) and the mean €30,290.32 (down from €33,441.48 the previous quarter and down from €33,446.00 last year).
- Twenty-eight states saw their per capita GDP contract in current euros from the previous quarter.
- Twenty-eight states saw their per capita GDP contract in current euros from last year.
Caveats
- GDP data is from the second quarter of 2019, the first quarter of 2020, and the second quarter of 2020.
- Census data is from 2011.
- The data is seasonally adjusted in current euros.
- The data is annualized by multiplying the quarterly figure by four.
- All figures are rounded to the nearest hundredth.
Details
In absolute terms, the United Kingdom had the worst performance over the previous quarter with a drop of €6,906.96. Bulgaria had the best performance with a drop of €721.80. Year over year, Austria had the worst performance with a drop of €6,316.91 while Bulgaria had the best performance with a drop of €569.33.
In relative terms, Croatia had the worst performance over the previous quarter with a 18.18% drop in per capita GDP while Finland had the best performance with a 4.57% drop in per capita GDP. Year over year, Spain had the worst performance with a 20.74% drop in per capita GDP while Ireland had the best performance with a 1.61% drop in per capita GDP.
The number of states with a per capita GDP of over €75,000 was two last year, two the previous quarter, and two this past quarter. Conversely, the number of states with a per capita GDP of less than €20,000 was nine last year, ten the previous quarter, and 12 this past quarter.
Finland (went from 7th highest per capita GDP to 6th highest), Estonia (from 18th to 17th), Lithuania (from 22nd to 21st), and Poland (from 25th to 24th) each surpassed one state over the previous quarter. On the flip side, Austria (from 6th to 7th), Czechia (from 17th to 18th), Greece (from 21st to 22nd), and Hungary (from 24th to 25th) were each bested by one state over the quarter. Year over year, Finland (7th to 6th), Germany (9th to 8th), Cyprus (15th to 14th), Estonia (18th to 17th), Lithuania (from 22nd to 21st), and Poland (from 25th to 24th) each rose one spot. Conversely, Austria (6th to 7th), Belgium (8th to 9th), Spain (14th to 15th), Czechia (17th to 18th), Greece (from 21st to 22nd), and Hungary (from 24th to 25th) were each bested by one state from the previous year.
Data
| State | Second Quarter 2019 | First Quarter 2020 | Second Quarter 2020 |
|---|---|---|---|
| Austria | 47,320.72 | 46,300.42 | 41,003.81 |
| Belgium | 42,847.7 | 41,793.58 | 36,825.5 |
| Bulgaria | 8,261.97 | 8,414.44 | 7,692.64 |
| Croatia | 12,486.29 | 12,597.16 | 10,306.64 |
| Cyprus | 26,119.17 | 26,114.41 | 22,357.1 |
| Czechia | 21,247.8 | 21,432.34 | 18,731.79 |
| Denmark | 56,030.22 | 56,285.15 | 52,647.58 |
| Estonia | 20,854.96 | 20,911.81 | 19,098.12 |
| Finland | 44,953.23 | 44,681.61 | 42,637.44 |
| France | 37,301.69 | 35,736.93 | 31,640.39 |
| Germany | 42,817.85 | 42,834.8 | 39,015.4 |
| Greece | 16,914.98 | 16,477.28 | 14,049.42 |
| Hungary | 14,609.46 | 14,483.64 | 12,377.83 |
| Ireland | 76,775.92 | 80,939.32 | 75,540.54 |
| Italy | 30,100.8 | 28,678.18 | 25,140.42 |
| Latvia | 14,651.08 | 14,528.07 | 13,253.41 |
| Lithuania | 15,888.29 | 16,198.45 | 15,124.08 |
| Luxembourg | 123,801.19 | 124,909.35 | 118,991.87 |
| Malta | 32,706.41 | 31,783.97 | 28,325.57 |
| Netherlands | 48,368.31 | 48,873.79 | 44,846.63 |
| Poland | 13,843.31 | 14,274.07 | 12,609.77 |
| Portugal | 20,014.37 | 19,890.21 | 17,496.88 |
| Romania | 11,077.09 | 10,940.39 | 10,027.16 |
| Slovakia | 17,359.47 | 17,012.98 | 15,545.9 |
| Slovenia | 23,505.54 | 23,051.92 | 20,885.1 |
| Spain | 26,590 | 25,525.09 | 21,074.09 |
| Sweden | 50,041.92 | 50,775 | 46,873.76 |
| United Kingdom | 39,998.25 | 40,917.04 | 34,010.08 |
Sources
Eurostat. 2020. "GDP and Main Components." Accessed October 15, 2020. https://appsso.eurostat.ec.europa.eu/nui/show.do?query=BOOKMARK_DS-406779_QID_75E42079_UID_-3F171EB0&layout=TIME,C,X,0;GEO,L,Y,0;UNIT,L,Z,0;S_ADJ,L,Z,1;NA_ITEM,L,Z,2;INDICATORS,C,Z,3;&zSelection=DS-406779UNIT,CP_MEUR;DS-406779INDICATORS,OBS_FLAG;DS-406779S_ADJ,SCA;DS-406779NA_ITEM,B1GQ;&rankName1=UNIT_1_2_-1_2&rankName2=INDICATORS_1_2_-1_2&rankName3=NA-ITEM_1_2_-1_2&rankName4=S-ADJ_1_2_-1_2&rankName5=TIME_1_0_0_0&rankName6=GEO_1_2_0_1&sortC=ASC_-1_FIRST&rStp=&cStp=&rDCh=&cDCh=&rDM=true&cDM=true&footnes=false&empty=false&wai=false&time_mode=NONE&time_most_recent=false&lang=EN&cfo=%23%23%23%2C%23%23%23.%23%23%23.
Eurostat. 2017. "Population on 1 January by Age Groups and Sex - Functional Urban Areas." Accessed December 11, 2017. http://appsso.eurostat.ec.europa.eu/nui/show.do?dataset=urb_lpop1&lang=en.