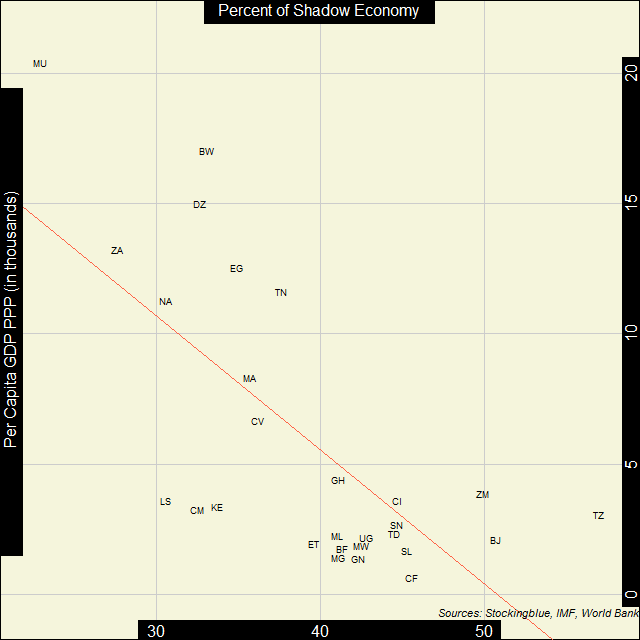
In Africa, the correlation between economic strength and the strength of the shadow economy is pretty strong. Crime certainly doesn't pay, it seems.
Findings
- The correlation coefficient between per capita Gross Domestic Product (GDP) in Purchasing Power Parity (PPP) and shadow economies in Africa is -0.70.
- As economic strength increases in Africa, the shadow economy decreases.
- Mauritius has the smallest shadow economy and the largest per capita GDP PPP of the African nations studied by the Global Foundation for Integrity (GFI).
- Tanzania had the largest shadow economy of the African nations studied by GFI.
- The Central African Republic had the smallest per capita GDP PPP of the African nations studied by GFI.
- Benin and Tanzania are the only two African countries whose shadow economy adds up to over half of the economy as a whole.
Caveats
- As always, correlation does not imply causation.
- Congo, the Democratic Republic of Congo, Gambia, Mayotte, Reunion, Saint Helena, Sao Tome and Principe, Somalia, and Western Sahara were missing data.
- The GDP data is from 2016 while the shadow economy data is the average from 1999-2006.
Details
Only seven countries have a per capita GDP PPP of over 10,000 international dollars. Three of those (Mauritius, Namibia, and South Africa) also have the smallest shadow economies. The other four are not far behind.
There is a big cluster of countries whose per capita GDP PPP is less than 5,000 international dollars and whose shadow economies all make up 40-something percent of the overall economy.
However, there are also a handful of countries (Lesotho, Cameroon, and Kenya) who make the same amount but have a considerably smaller shadow economy.
Country Codes
| Code | Country |
|---|---|
| BF | Burkina Faso |
| BJ | Benin |
| BW | Botswana |
| CF | Central African Republic |
| CI | Cote d'Ivoire |
| CM | Cameroon |
| CV | Cape Verde |
| DZ | Algeria |
| EG | Egypt |
| ET | Ethiopia |
| GH | Ghana |
| GN | Guinea |
| KE | Kenya |
| LS | Lesotho |
| MA | Morocco |
| MG | Madagascar |
| ML | Mali |
| MU | Mauritius |
| MW | Malawi |
| NA | Namibia |
| SL | Sierra Leone |
| SN | Senegal |
| TD | Chad |
| TN | Tunisia |
| TZ | Tanzania |
| UG | Uganda |
| ZA | South Africa |
| ZM | Zambia |
Sources
Schneider, Friedrich, Andreas Buehn, and Claudio E. Montenegro. 2010. "Shadow Economies All over the World: New Estimates for 162 Countries from 1999 to 2007." The World Bank Development Research Group.