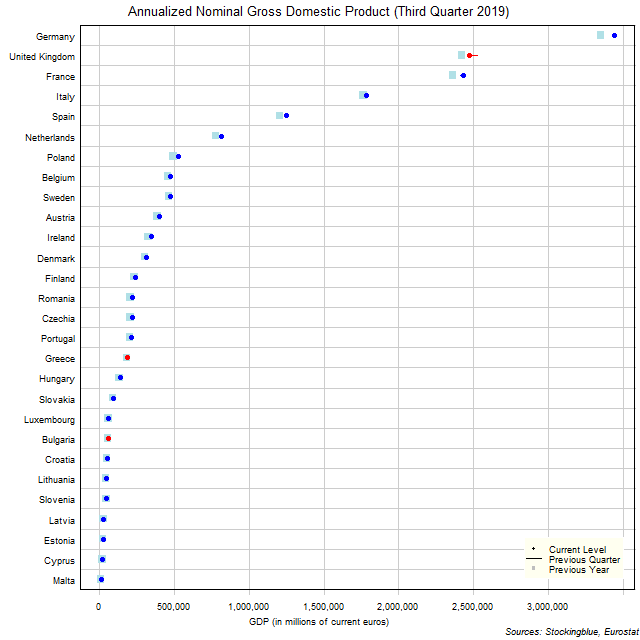
The chart above shows the annualized nominal gross domestic product (GDP) in each EU state as of the third quarter of 2019 in millions of euros, the change from the previous quarter, and the GDP one year prior. The United Kingdom, Greece, and Bulgaria are the only states to see a drop from the previous quarter.
Findings
- The difference between the state with the largest GDP, Germany, and the state with the smallest, Malta, is €3,424,906.80 million (up from €3,413,954.00 million last quarter and up from €3,336,557.60 million last year). Germany and Malta had the largest and smallest GDP respectively both last quarter and last year.
- Germany has 257.72 times the GDP that Malta does. The ratio of largest GDP to smallest GDP was down from 260.77 last quarter and down from 265.34 last year.
- The median GDP in the 28 EU states is €222,245.20 million (up from €217,971.80 million last quarter and up from €208,203.00 last year) and the mean €586,350.39 million (up from €585,435.14 the previous quarter and up from €569,034.89 last year).
- Twenty-five states saw their nominal GDP rise from the previous quarter while three saw it drop.
- All 28 states saw their nominal GDP rise from last year.
Caveats
- Data is from the third quarter of 2019, the second quarter of 2019, and the third quarter of 2018.
- The data is seasonally and calendar adjusted in current euros except for Slovakia which is only seasonally adjusted in current euros.
- The data is annualized by multiplying the quarterly figure by four.
- All figures are rounded to the nearest hundredth.
Details
In absolute terms, the United Kingdom saw the largest decrease over the previous quarter with a drop of €58,383.20 million. France had the largest growth with a gain of €13,752.00 million. Year over year, Malta had the smallest increase with a gain of €718.80 million while Germany had the greatest increase with a gain of €89,068.00 million.
In relative terms, the United Kingdom had the largest decrease over the previous quarter with a 2.31% drop in GDP while Romania had the greatest increase with a 2.75% rise in GDP. Year over year, Greece had the smallest increase with a 1.23% gain in GDP while Hungary had the largest growth with a 8.21% rise in GDP.
Germany accounted for over one-fifth of the economic output of the 28 states at 20.94%. It, with the United Kingdom accounted for just over one-third of the economic output of the 28 states at 35.98%. Adding in France amounts to just over half the economic output of the 28 states at 50.76%.
Belgium (from 9th to 8th largest GDP) and Romania (from 15th to 14th) each surpassed one state over the previous quarter. Conversely, Sweden (from 8th to 9th) and Czechia (from 14th to 15th) were each bested by one state. Year over year, Belgium (from 9th to 8th), Romania (from 15th to 14th), and Lithuania (from 24th to 23rd) each surpassed one state while Sweden (from 8th to 9th), Czechia (from 14th to 15th), and Slovenia (from 23rd to 24th) were each bested by one.
Data
| State | Third Quarter 2018 | Second Quarter 2019 | Third Quarter 2019 |
|---|---|---|---|
| Austria | 387,406.4 | 397,050.4 | 399,543.6 |
| Belgium | 459,460 | 472,108 | 474,672 |
| Bulgaria | 57,167.2 | 61,346.4 | 60,507.6 |
| Croatia | 52,027.2 | 53,587.6 | 54,372 |
| Cyprus | 21,048.4 | 22,045.2 | 22,187.6 |
| Czechia | 208,456 | 218,758.8 | 221,342 |
| Denmark | 303,792.8 | 308,805.2 | 312,475.2 |
| Estonia | 26,186 | 27,830.8 | 28,123.2 |
| Finland | 235,380 | 241,732 | 244,752 |
| France | 2,359,992 | 2,413,912 | 2,427,664 |
| Germany | 3,349,180 | 3,427,096 | 3,438,248 |
| Greece | 185,678.8 | 188,341.6 | 187,955.2 |
| Hungary | 133,334.8 | 143,132.8 | 144,284 |
| Ireland | 328,639.6 | 344,219.2 | 350,426.8 |
| Italy | 1,761,979.6 | 1,777,563.2 | 1,783,654 |
| Latvia | 29,494.8 | 30,464.4 | 30,787.6 |
| Lithuania | 45,572.4 | 47,960.8 | 48,510.4 |
| Luxembourg | 61,025.2 | 63,324.8 | 63,840 |
| Malta | 12,622.4 | 13,142 | 13,341.2 |
| Netherlands | 778,537.6 | 806,167.6 | 815,050.8 |
| Poland | 496,940.8 | 524,596.8 | 529,619.6 |
| Portugal | 205,030.8 | 209,952.8 | 212,295.2 |
| Romania | 207,950 | 217,184.8 | 223,148.4 |
| Slovakia | 90,678.4 | 93,531.2 | 94,240.8 |
| Slovenia | 46,466.8 | 47,893.2 | 48,478.4 |
| Spain | 1,205,068 | 1,241,524 | 1,247,668 |
| Sweden | 463,887.2 | 472,163.6 | 472,257.6 |
| United Kingdom | 2,419,973.6 | 2,526,748.8 | 2,468,365.6 |
Sources
Eurostat. 2020. "GDP and Main Components." Accessed January 29, 2020. https://appsso.eurostat.ec.europa.eu/nui/show.do?query=BOOKMARK_DS-406779_QID_-583B1285_UID_-3F171EB0&layout=TIME,C,X,0;GEO,L,Y,0;UNIT,L,Z,0;S_ADJ,L,Z,1;NA_ITEM,L,Z,2;INDICATORS,C,Z,3;&zSelection=DS-406779UNIT,CP_MEUR;DS-406779INDICATORS,OBS_FLAG;DS-406779S_ADJ,SCA;DS-406779NA_ITEM,B1GQ;&rankName1=UNIT_1_2_-1_2&rankName2=INDICATORS_1_2_-1_2&rankName3=NA-ITEM_1_2_-1_2&rankName4=S-ADJ_1_2_-1_2&rankName5=TIME_1_0_0_0&rankName6=GEO_1_2_0_1&sortC=ASC_-1_FIRST&rStp=&cStp=&rDCh=&cDCh=&rDM=true&cDM=true&footnes=false&empty=false&wai=false&time_mode=NONE&time_most_recent=false&lang=EN&cfo=%23%23%23%2C%23%23%23.%23%23%23.