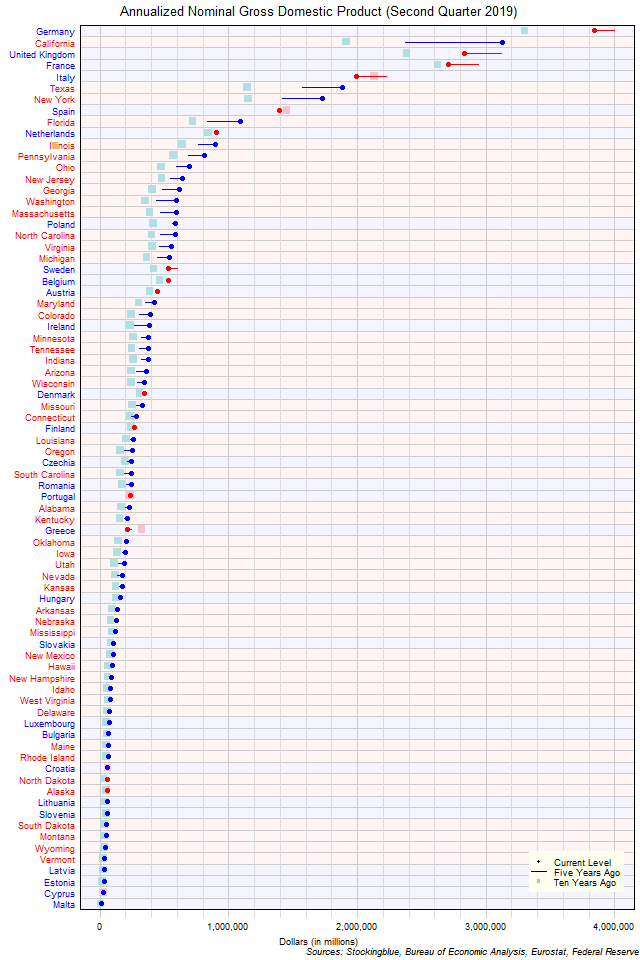
The chart above shows the annualized nominal gross domestic product (GDP) in each EU and US state as of the second quarter of 2019 in millions of US dollars, the change from five years ago, and the GDP ten years prior. Germany continues to be the largest economy but California is hot on its tail.
Findings
- The difference between the state with the largest GDP, Germany, and the state with the smallest, Malta, is $3,823,628.48 million (down from $3,984,297.02 million five years ago and up from $3,292,506.14 million ten years ago). Germany and Malta had the largest and smallest GDP respectively both five and ten years ago.
- Germany has 260.77 times the GDP that Malta does. The ratio of largest GDP to smallest GDP was down from 347.47 five years ago and down from 398.95 ten years ago.
- The median GDP in the 28 EU states is $244,216.45 million (up from $239,317.08 million five years ago and up from $236,276.88 ten years ago) and the mean $655,804.27 million (down from $685,960.10 five years ago and up from $595,930.41 ten years ago).
- The median GDP in the 50 US states is $247,742.35 million (up from $194,401.35 million five years ago and up from $163,885.30 ten years ago) and the mean $421,496.95 million (up from $344,000.55 five years ago and up from $283,083.12 ten years ago).
- The median GDP in the 78 EU and US states is $245,115.99 million (up from $224,677.26 million five years ago and up from $201,478.85 ten years ago) and the mean $505,607.27 million (up from $466,755.26 five years ago and up from $395,387.28 ten years ago).
- Sixty-three states saw their GDP rise in current dollars from five years ago (48 from the US and 15 from the EU) while 15 states saw their GDP drop in current dollars (two from the US and 13 from the EU).
- Seventy-two states saw their GDP rise in current dollars from ten years ago (50 from the US and 22 from the EU) while six states saw their GDP drop in current dollars (zero from the US and six from the EU).
- All EU drops in GDP with the exception of Greece's ten year drop are attributed to currency rate fluctuations.
Caveats
- Data is from the second quarters of 2019, 2014, and 2009.
- The data is seasonally adjusted in current dollars.
- Euros are converted to dollars at an average exchange rate of 1.12 for the second quarter of 2019, 1.37 for the second quarter of 2014, and 1.36 for the second quarter of 2009 according to historic rates listed at the Federal Reserve (see source link below).
- US data comes in an annualized format which the EU does not, thus EU data is annualized by multiplying the quarterly figure by four.
- US growth rates may differ from those provided by the Bureau of Economic Analysis as the BEA's growth rates are based on chained dollars in conjunction with the chain index or the quality index for real GDP. The growth rates listed here are based on nominal GDP.
- All figures are rounded to the nearest hundredth.
Details
In absolute terms, the United Kingdom saw the largest decrease over the past five years with a drop of $291,242.20 million. California had the largest growth with a gain of $751,463.40 million. Over the past ten years, Italy had the largest decrease with a drop of $142,737.47 million while California had the greatest increase with a gain of $1,211,205.00 million.
In relative terms, Greece had the largest decrease over the past five years with a 13.03% drop in GDP while Ireland had the greatest increase with a 43.35% rise in GDP. Over the past ten years, Greece had the largest decrease with a 35.37% drop in GDP while North Dakota had the largest growth with a 81.22% rise in GDP.
There were 51 states (18 EU, 33 US) with a GDP of over $100,000 million ten years ago, 55 states (19 EU, 36 US) five years ago, and 56 states (19 EU, 37 US) now. On the flip side, there were 14 states (7 EU, 7 US) with a GDP of less than $50,000 million ten years ago, nine states (5 EU, 4 US) five years ago, and six states (4 EU, 2 US) now.
Washington (from 24th largest GDP to 16th largest GDP out of 78) and Ireland (from 35th to 27th) overcame the most states in the five year period. Conversely, Sweden (from 13th to 22nd) was surpassed by nine states in the five year period. Over the past ten years, Ireland (from 38th to 27th) surpassed 11 states, while Greece (from 25th to 45th) was surpassed by 20.
Sources
Eurostat. 2019. "GDP and Main Components." Accessed December 23, 2019. https://appsso.eurostat.ec.europa.eu/nui/show.do?query=BOOKMARK_DS-406779_QID_-2B92021B_UID_-3F171EB0&layout=TIME,C,X,0;GEO,L,Y,0;UNIT,L,Z,0;S_ADJ,L,Z,1;NA_ITEM,L,Z,2;INDICATORS,C,Z,3;&zSelection=DS-406779UNIT,CP_MEUR;DS-406779INDICATORS,OBS_FLAG;DS-406779S_ADJ,SCA;DS-406779NA_ITEM,B1GQ;&rankName1=UNIT_1_2_-1_2&rankName2=INDICATORS_1_2_-1_2&rankName3=NA-ITEM_1_2_-1_2&rankName4=S-ADJ_1_2_-1_2&rankName5=TIME_1_0_0_0&rankName6=GEO_1_2_0_1&sortC=ASC_-1_FIRST&rStp=&cStp=&rDCh=&cDCh=&rDM=true&cDM=true&footnes=false&empty=false&wai=false&time_mode=NONE&time_most_recent=false&lang=EN&cfo=%23%23%23%2C%23%23%23.%23%23%23.
Federal Reserve. 2019. "Foreign Exchange Rates." Accessed December 24, 2019. https://www.federalreserve.gov/releases/g5/.
US Bureau of Economic Analysis. 2019. "GDP by State." Accessed December 20, 2019. https://www.bea.gov/data/gdp/gdp-state.