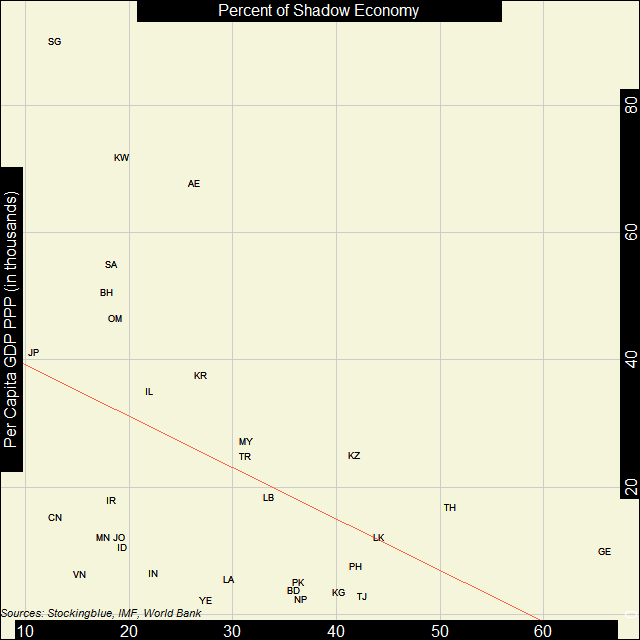
In Asia, the correlation between economic strength and the strength of the shadow economy is pretty weak. Every country studied on the continent - excluding Thailand and Georgia - has a shadow economy that takes up at most one-half of its overall economy.
Findings
- The correlation coefficient between per capita Gross Domestic Product (GDP) in Purchasing Power Parity (PPP) and shadow economies in Asia is -0.45.
- As economic strength increases in Europe, the shadow economy does not necessarily decrease.
- Just like in Europe, the country with the smallest shadow economy (Japan) does not have the largest per capita GDP PPP of the European nations studied by the Global Foundation for Integrity (GFI).
- Singapore has the largest per capita GDP PPP, yet it only has the second smallest shadow activity as a percentage of its overall economy.
- Georgia had the largest shadow economy of the Asian nations studied by GFI.
- Yemen had the smallest per capita GDP PPP but relative to other Asian nations has a small shadow economy.
- Thailand and Georgia are the only Asian countries whose shadow economies take up over half of their economies as a whole.
Caveats
- As always, correlation does not imply causation.
- Afghanistan, Armenia, Azerbaijan, Bhutan, The British Indian Ocean Territory, Brunei, Cambodia, Cocos Islands, Cyprus, Hong Kong, Iraq, Macao, Maldives, Myanmar, North Korea, Palestine, Qatar, Syria, Taiwan, Turkmenistan, and Uzbekistan were missing data.
- The GDP data is from 2016 while the shadow economy data is the average from 1999-2006.
Details
Unlike Europe, Asian countries do not cluster around each other with regards to their per capita GDP PPP and shadow economy strength on a geographical basis. There are countries from every region of Asia scattered throughout the graph. However, there are still some noticeable patterns. Former Soviet states (Georgia, Kazakhstan, Kyrgyzstan, Tajikistan) tend to have larger shadow economies, countries in the Arabian peninsula (Bahrain, Oman, Kuwait, Saudi Arabia, United Arab Emirates) tend to have higher per capita GDP PPP and small shadow economies, and there is a cluster of South Asian states (Bangladesh, Nepal, Pakistan) with low per capita GDP PPP and a moderate shadow economy.
Sri Lanka and India are not part of the aforementioned South Asian cluster although they have similar incomes to the other South Asian countries, Sri Lanka has a larger shadow economy and India has a smaller one.
Georgia's shadow economy takes up nearly two-thirds of its overall economy.
Country Codes
| Code | Country |
|---|---|
| AE | United Arab Emirates |
| BD | Bangladesh |
| BH | Bahrain |
| CN | China |
| GE | Georgia |
| ID | Indonesia |
| IL | Israel |
| IN | India |
| IR | Iran |
| JO | Jordan |
| JP | Japan |
| KG | Kyrgyzstan |
| KR | South Korea |
| KW | Kuwait |
| KZ | Kazakhstan |
| LA | Laos |
| LB | Lebanon |
| LK | Sri Lanka |
| MN | Mongolia |
| MY | Malaysia |
| NP | Nepal |
| OM | Oman |
| PH | Philippines |
| PK | Pakistan |
| SA | Saudi Arabia |
| SG | Singapore |
| TH | Thailand |
| TJ | Tajikistan |
| TR | Turkey |
| VN | Vietnam |
| YE | Yemen |
Sources
Schneider, Friedrich, Andreas Buehn, and Claudio E. Montenegro. 2010. "Shadow Economies All over the World: New Estimates for 162 Countries from 1999 to 2007." The World Bank Development Research Group.