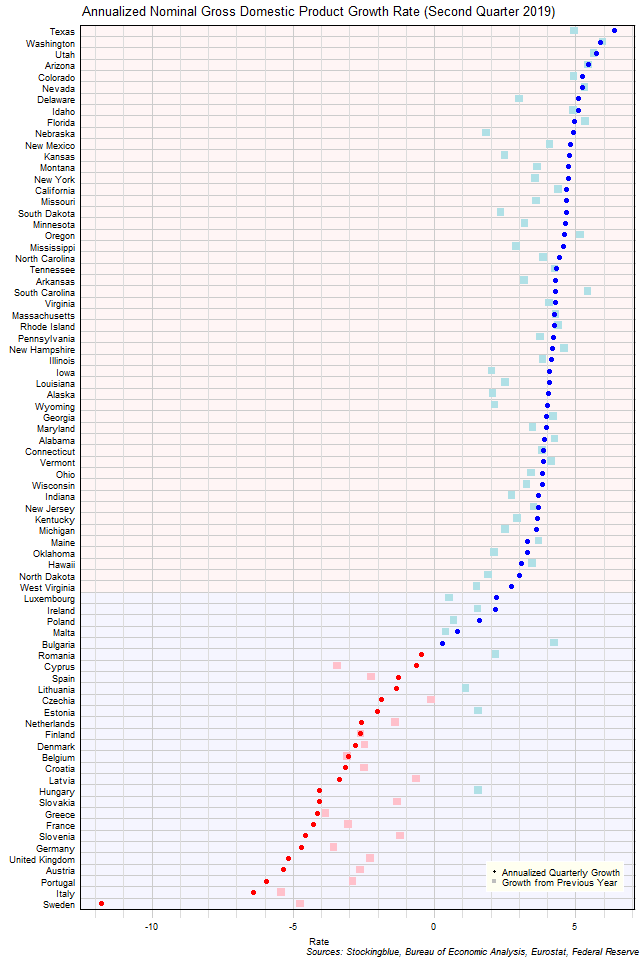
The chart above shows the annualized nominal gross domestic product (GDP) quarterly growth rate when the GDP is priced in US dollars in each EU and US state as of the second quarter of 2019 and the growth rate from one year prior. No US states had any negative growth over the past quarter or year whereas 23 out of 28 EU states experienced negative growth in either the past quarter, past year, or both.
Findings
- The difference between the state with the largest annualized quarterly growth rate, Texas, and the state with the smallest, Sweden, is 18.16 percentage points.
- The difference between the state with the largest year-over-year growth rate, Washington, and the state with the smallest, Italy, is 11.36 percentage points.
- The median annualized quarterly growth rate in the 28 EU states is -2.92% and the mean -2.81%. The median year-over-year growth rate in the 28 EU states is -1.81% and the mean -1.27%.
- The median annualized quarterly growth rate in the 50 US states is 4.26% and the mean 4.33%. The median year-over-year growth rate in the 50 US states is 3.66% and the mean 3.68%.
- The median annualized quarterly growth rate in the 78 EU and US states is 3.82% and the mean 1.77%. The median year-over-year growth rate in the 78 EU and US states is 2.82% and the mean 1.90%.
- Forty-three states' economies grew faster over the previous quarter than they did over the same quarter last year (7 from the EU, 36 from the US). One state (from the US) saw the same growth over both time periods. The remaining 34 states saw their economies grow slower over the previous quarter than they did over the same quarter last year (21 EU, 13 US).
- All EU drops in GDP growth rate except for Sweden's quarterly growth are attributed to currency rate fluctuations.
Caveats
- Data is from the second quarter of 2019, the first quarter of 2019, and the second quarter of 2018.
- The data is seasonally and calendar adjusted in current dollars except for Slovakia which is only seasonally adjusted in current dollars.
- Euros are converted to dollars at an average exchange rate of 1.12 for the second quarter of 2019, 1.14 for the first quarter of 2019, and 1.19 for the second quarter of 2018 according to historic rates listed at the Federal Reserve (see source link below).
- US data comes in an annualized format which the EU does not, thus EU data is annualized by multiplying the quarterly figure by four.
- US growth rates may differ from those provided by the Bureau of Economic Analysis as the BEA's growth rates are based on chained dollars in conjunction with the chain index or the quality index for real GDP. The growth rates listed here are based on nominal GDP.
- All figures are rounded to the nearest hundredth.
Details
Sweden had the largest decline over the previous quarter with an annualized drop of 11.80%. Texas had the largest growth with an annualized gain of 6.36%.
Year over year, Italy had the largest decline with a 5.41% drop in GDP while Washington had the largest growth with a 5.95% rise in GDP.
Sweden saw the largest decrease in its growth rate between its year-over-year growth and its annualized quarterly growth slowing its rate by 7.05 percentage points. Nebraska had the largest increase in its growth rate between its year-over-year growth and its annualized quarterly growth ramping up its rate by 3.09 percentage points.
Nebraska went from having the 51st largest growth rate over the same quarter last year to the 10th largest growth rate over the previous quarter. Conversely, Bulgaria went from having the 17th highest growth rate over the same quarter last year to the 55th highest growth rate over the previous quarter. Three states had growth rates in the top five both over the same quarter last year and over the previous quarter: Washington (highest growth rate year-over-year, 2nd highest quarterly), Utah (2nd highest year-over-year, 3rd highest quarterly), and Arizona (3rd highest year-over-year, 4th highest quarterly). Three states had growth rates in the bottom five both over the same quarter last year and over the previous quarter: Germany (75th highest year-over-year, 73rd highest quarterly), Italy (78th highest year-over-year, 77th highest quarterly), and Sweden (77th highest year-over-year, 78th highest quarterly).
Sources
Eurostat. 2019. "GDP and Main Components." Accessed November 15, 2019. https://appsso.eurostat.ec.europa.eu/nui/show.do?query=BOOKMARK_DS-406779_QID_1F30ECEB_UID_-3F171EB0&layout=TIME,C,X,0;GEO,L,Y,0;UNIT,L,Z,0;S_ADJ,L,Z,1;NA_ITEM,L,Z,2;INDICATORS,C,Z,3;&zSelection=DS-406779UNIT,CP_MEUR;DS-406779INDICATORS,OBS_FLAG;DS-406779S_ADJ,SCA;DS-406779NA_ITEM,B1GQ;&rankName1=UNIT_1_2_-1_2&rankName2=INDICATORS_1_2_-1_2&rankName3=NA-ITEM_1_2_-1_2&rankName4=S-ADJ_1_2_-1_2&rankName5=TIME_1_0_0_0&rankName6=GEO_1_2_0_1&sortC=ASC_-1_FIRST&rStp=&cStp=&rDCh=&cDCh=&rDM=true&cDM=true&footnes=false&empty=false&wai=false&time_mode=NONE&time_most_recent=false&lang=EN&cfo=%23%23%23%2C%23%23%23.%23%23%23.
Federal Reserve. 2019. "Foreign Exchange Rates." Accessed November 18, 2019. https://www.federalreserve.gov/releases/g5/.
US Bureau of Economic Analysis. 2019. "GDP by State." Accessed November 14, 2019. https://www.bea.gov/data/gdp/gdp-state.