The Correlation between GDP PPP Per Capita and GDP PPP Per Area Worldwide

Oct 23, 2017
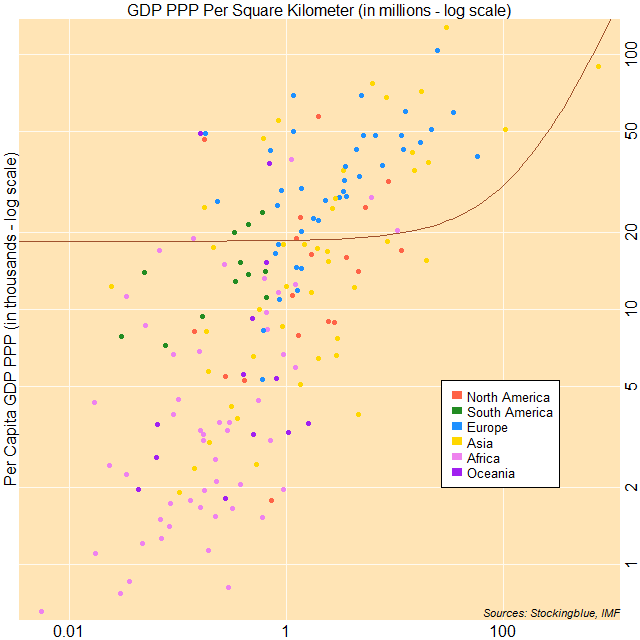
Scatter plot of per capita GDP PPP and GDP PPP per area

The correlation between per capita gross domestic product based on purchasing power parity (GDP PPP) and GDP PPP per area worldwide is moderately weak.  The three largest economies on a per capita basis have a high per area GDP relative to other countries.

Findings

  • The correlation coefficient between per capita Gross Domestic Product (GDP) in Purchasing Power Parity (PPP) and minimum wage in worldwide is 0.33.
  • As the per capita GDP PPP increases in worldwide, the per area GDP PPP somewhat increases.
  • Africa has the country with both the lowest per capita GDP PPP and the lowest per area GDP PPP.
  • Asia has the countries with the highest per capita GDP PPP and the highest per area GDP PPP.

Caveats

  • As always, correlation does not imply causation.
  • Several countries are not included as they were missing data.  See the continent reports for complete lists.

Details

Europe and Asia are the only continents with countries that have a per capita GDP PPP of over 100,000 international dollars.  Asia is also the only continent with countries that make more than one million international dollars per square kilometer.

Africa is the only continent with countries that have a per capita GDP PPP below one thousand international dollars and also the only continent with countries that make less than 10,000 international dollars per square kilometer.

Europe and South America are the only continents where their countries are clustered around each other.  Asia, on the other hand has countries dispersed all over the GDP spectrum on both the per capita and per area bases.

Sources

"Report for Selected Country Groups and Subjects (PPP Valuation of Country GDP)."  https://www.imf.org/external/pubs/ft/weo/2017/01/weodata/weorept.aspx?pr.x=43&pr.y=19&sy=2017&ey=2017&scsm=1&ssd=1&sort=country&ds=.&br=1&c=512%2C672%2C914%2C946%2C612%2C137%2C614%2C546%2C311%2C962%2C213%2C674%2C911%2C676%2C193%2C548%2C122%2C556%2C912%2C678%2C313%2C181%2C419%2C867%2C513%2C682%2C316%2C684%2C913%2C273%2C124%2C868%2C339%2C921%2C638%2C948%2C514%2C943%2C218%2C686%2C963%2C688%2C616%2C518%2C223%2C728%2C516%2C558%2C918%2C138%2C748%2C196%2C618%2C278%2C624%2C692%2C522%2C694%2C622%2C142%2C156%2C449%2C626%2C564%2C628%2C565%2C228%2C283%2C924%2C853%2C233%2C288%2C632%2C293%2C636%2C566%2C634%2C964%2C238%2C182%2C662%2C359%2C960%2C453%2C423%2C968%2C935%2C922%2C128%2C714%2C611%2C862%2C321%2C135%2C243%2C716%2C248%2C456%2C469%2C722%2C253%2C942%2C642%2C718%2C643%2C724%2C939%2C576%2C644%2C936%2C819%2C961%2C172%2C813%2C132%2C199%2C646%2C733%2C648%2C184%2C915%2C524%2C134%2C361%2C652%2C362%2C174%2C364%2C328%2C732%2C258%2C366%2C656%2C734%2C654%2C144%2C336%2C146%2C263%2C463%2C268%2C528%2C532%2C923%2C944%2C738%2C176%2C578%2C534%2C537%2C536%2C742%2C429%2C866%2C433%2C369%2C178%2C744%2C436%2C186%2C136%2C925%2C343%2C869%2C158%2C746%2C439%2C926%2C916%2C466%2C664%2C112%2C826%2C111%2C542%2C298%2C967%2C927%2C443%2C846%2C917%2C299%2C544%2C582%2C941%2C474%2C446%2C754%2C666%2C698%2C668&s=PPPGDP&grp=0&a=.  International Monetary Fund.

Filed under: Correlations