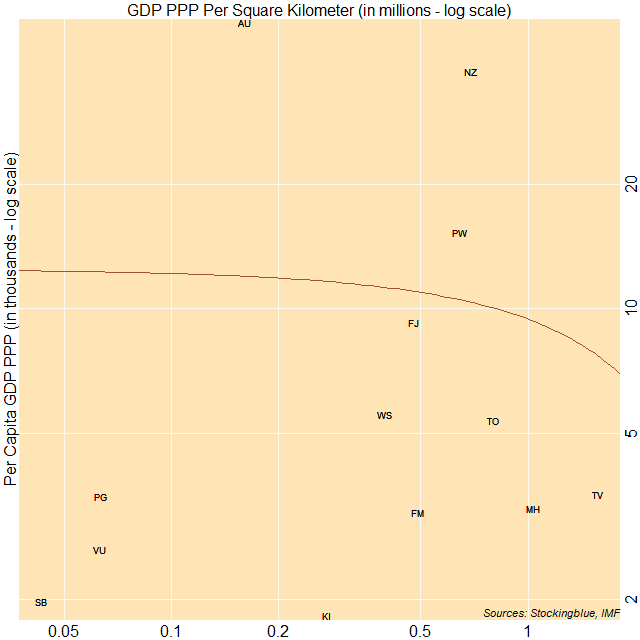
The correlation between per capita gross domestic product based on purchasing power parity (GDP PPP) and GDP PPP per area in Oceania is weak. The three largest economies on a per capita basis have either a moderate or high per area GDP relative to other countries on the continent.
Findings
- The correlation coefficient between per capita Gross Domestic Product (GDP) in Purchasing Power Parity (PPP) and minimum wage in Oceania is -0.09.
- As the per capita GDP PPP increases in Oceania, the per area GDP PPP does not necessarily decrease.
- Kiribati has the lowest per capita GDP PPP and the fifth lowest per area GDP PPP.
- The Solomon Islands have the lowest per area GDP PPP and the second lowest per capita GDP PPP.
- Australia has the highest per capita GDP PPP but the fourth lowest per area GDP PPP.
- Tuvalu on the other hand, has the highest per area GDP PPP but the seventh lowest per capita GDP PPP.
Caveats
- As always, correlation does not imply causation.
- American Samoa, Bouvet Island, Cook Islands, French Polynesia, Guam, Heard Island and McDonald Islands, Nauru, New Caledonia, Niue, Norfolk Island, Northern Mariana Islands, Pitcairn, Tokelau, and Wallis and Futuna were missing data.
Details
This is the only continent where there is an inverse relationship between per capita GDP PPP and per area GDP PPP. The relationship between the two is extremely weak, however.
Every country that makes less than 100,000 international dollars also has a per capita GDP PPP below 5,000 international dollars.
Country Codes
| Code | Country | GDP PPP Per Square Kilometer | Per Capita GDP PPP |
|---|---|---|---|
| AU | Australia | 161,656.17 | 48,899 |
| FJ | Fiji | 481,449.05 | 9,268 |
| KI | Kiribati | 273,736.13 | 1,823 |
| MH | Marshall Islands | 1,038,674.03 | 3,301 |
| FM | Micronesia | 491,452.99 | 3,234 |
| NZ | New Zealand | 693,637.06 | 37,294 |
| PW | Palau | 648,471.62 | 15,319 |
| PG | Papua New Guinea | 63,695.88 | 3,541 |
| WS | Samoa | 398,799.01 | 5,553 |
| SB | Solomon Islands | 43,154.76 | 1,973 |
| TO | Tonga | 799,196.79 | 5,386 |
| TV | Tuvalu | 1,576,923.08 | 3,567 |
| VU | Vanuatu | 63,335.79 | 2,631 |