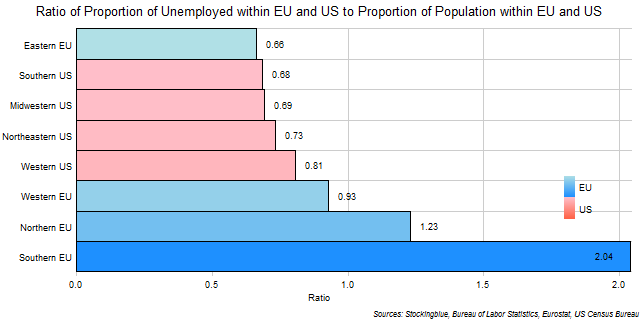
The chart above shows the ratio of the region's proportion of unemployed people in the EU and US to the region's proportion of total people in the EU and US. The Southern EU's unemployed population as a share of the total unemployed population in the EU and the US is twice as large as its total population's share of the total population in the EU and the US.
Findings
- The difference between the region with the lowest ratio of unemployed within the EU and the US to people within the EU and the US, the Eastern EU, and the region with the highest, the Southern EU, is 1.38.
- The Eastern EU has 0.32 times - or nearly one-third - the ratio that the Southern EU does.
Caveats
- Unemployment data is from December 2018.
- EU population data is from 2011. US population data is from 2010.
- All figures are rounded to the nearest hundredth.
- The Eastern EU consists of Poland, Czech Republic, Romania, Hungary, Slovakia, Bulgaria, Croatia, Slovenia, Lithuania, Latvia, and Estonia.
- The Southern US consists of Texas, Florida, Georgia, North Carolina, Virginia, Tennessee, Louisiana, South Carolina, Alabama, Kentucky, Oklahoma, Arkansas, Mississippi, and West Virginia.
- The Midwestern US consists of Illinois, Ohio, Michigan, Indiana, Minnesota, Wisconsin, Missouri, Iowa, Kansas, Nebraska, North Dakota, and South Dakota.
- The Northeastern US consists of New York, Pennsylvania, New Jersey, Massachusetts, Maryland, Connecticut, New Hampshire, Delaware, Maine, Rhode Island, and Vermont.
- The Western US consists of California, Washington, Colorado, Arizona, Oregon, Utah, Nevada, New Mexico, Hawaii, Idaho, Alaska, Montana, and Wyoming.
- The Western EU consists of Germany, United Kingdom, France, Netherlands, Belgium, Austria, Ireland, and Luxembourg.
- The Northern EU consists of Sweden, Denmark, and Finland.
- The Southern EU consists of Italy, Spain, Portugal, Greece, Cyprus, and Malta.
Details
Eastern EU states have a ratio that ranges from a low of 0.40 in the Czech Republic to a high of 1.29 in Latvia. Southern US states have a ratio that ranges from a low of 0.56 in Virginia to a high of 0.84 in Louisiana. Midwestern US states have a ratio that ranges from a low of 0.47 in Iowa to a high of 0.84 in Ohio. Northeastern US states have a ratio that ranges from a low of 0.50 in New Hampshire to a high of 0.79 in Maryland. Western US states have a ratio that ranges from a low of 0.47 in Hawaii to a high of 1.11 in Alaska. Western EU states have a ratio that ranges from a low of 0.63 in Germany to a high of 1.52 in France. Northern EU states have a ratio that ranges from a low of 1.00 in Denmark to a high of 1.34 in Sweden. Southern EU states have a ratio that ranges from a low of 0.80 in Malta to a high of 2.95 in Greece.
Two states have a ratio higher than that of the Southern EU: Spain and Greece, both from the Southern EU. On the other end of the spectrum, 24 states have a ratio lower than the Eastern EU as a whole (five from the EU and 19 from the US): four are from the Eastern EU (the Czech Republic, Poland, Romania, and Hungary), one is from the Western EU (Germany), eight are from the Midwestern US (Iowa, Missouri, Nebraska, Minnesota, South Dakota, Wisconsin, North Dakota, and Kansas), two from the Northeastern US (New Hampshire and Vermont), six from the Southern US (Virginia, Oklahoma, South Carolina, Arkansas, Alabama, and Florida), and three are from the Western US (Hawaii, Idaho, and Utah).
Of the 14 states that have a share of unemployed people relative to the unemployed people in the two superstates that is larger than their share of the total population of the two superstates, 13 are from the EU and only one, Alaska, is from the US.
Of the three states that have a share of unemployed people relative to the unemployed people in the two superstates that is less than half their share of the total population of the two superstates, one is from the EU, the Czech Republic, and two, Iowa and Hawaii, are from the US.
Sources
Bureau of Labor Statistics. 2019. "State Employment and Unemployment (Monthly) News Release." Accessed February 6, 2019. https://www.bls.gov/news.release/archives/laus_01182019.htm.
Eurostat. 2017. "Population on 1 January by Age Groups and Sex - Functional Urban Areas." Accessed December 11, 2017. http://appsso.eurostat.ec.europa.eu/nui/show.do?dataset=urb_lpop1&lang=en.
Eurostat. 2019. "Unemployment by Sex and Age - Monthly Average." Accessed February 6, 2019. http://appsso.eurostat.ec.europa.eu/nui/show.do?query=BOOKMARK_DS-055624_QID_6C6753DD_UID_-3F171EB0&layout=TIME,C,X,0;GEO,L,Y,0;S_ADJ,L,Z,0;AGE,L,Z,1;UNIT,L,Z,2;SEX,L,Z,3;INDICATORS,C,Z,4;&zSelection=DS-055624SEX,T;DS-055624UNIT,PC_ACT;DS-055624S_ADJ,SA;DS-055624AGE,TOTAL;DS-055624INDICATORS,OBS_FLAG;&rankName1=TIME_1_0_0_0&rankName2=UNIT_1_2_-1_2&rankName3=GEO_1_2_0_1&rankName4=AGE_1_2_-1_2&rankName5=INDICATORS_1_2_-1_2&rankName6=SEX_1_2_-1_2&rankName7=S-ADJ_1_2_-1_2&sortC=ASC_-1_FIRST&rStp=&cStp=&rDCh=&cDCh=&rDM=true&cDM=true&footnes=false&empty=false&wai=false&time_mode=NONE&time_most_recent=false&lang=EN&cfo=%23%23%23%2C%23%23%23.%23%23%23.
United States Census Bureau. September 2012. "United States Summary: 2010: Population and Housing Unit Counts." Accessed January 23, 2018. https://www.census.gov/prod/cen2010/cph-2-1.pdf.