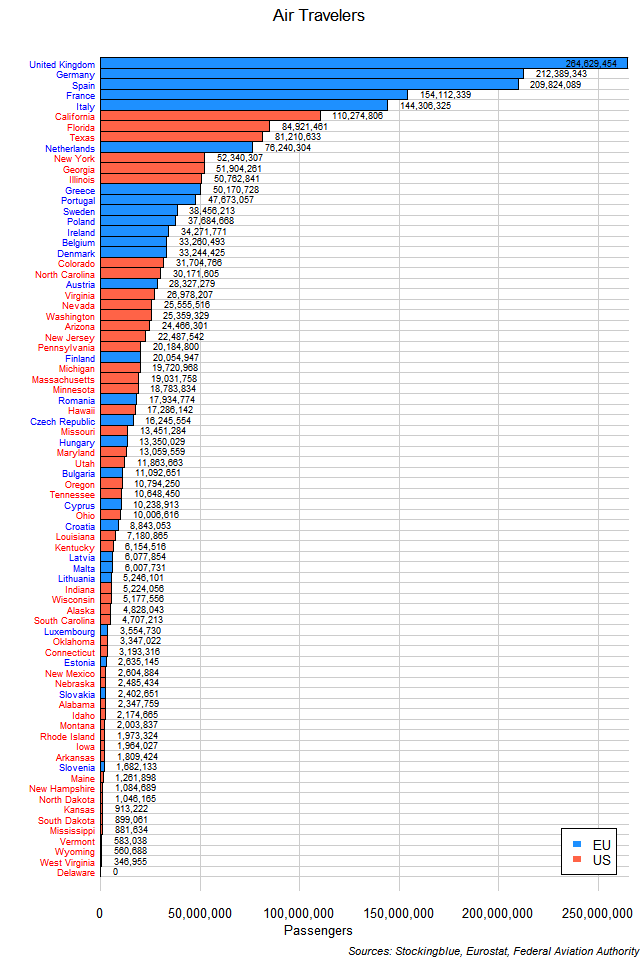
The chart above shows the number of passengers that traveled by air in each EU and US state. The five states with the most air passengers are from the EU. The highest ranked US state, California, ranks sixth overall.
Findings
- The difference between the state with the greatest number of air travelers, the United Kingdom, and the state with the least (which has commercial airports), West Virginia, is 264,282,499 passengers.
- The United Kingdom has 762.71 times the number of air travelers that West Virginia does.
- The difference between the EU state with the most air travelers, the United Kingdom, and the US state with the most, California, is 154,354,648 passengers.
- The United Kingdom has 2.40 times the number of air travelers that California does.
- Delaware is the only state in both the EU and the US without a single busy airport.
- The median number of air passengers in the 28 EU states is 24,191,113 and the mean 53,212,741.
- The median number of air passengers in the 50 US states is 6,667,690 and the mean 16,954,444.
- The median number of air passengers in the 78 EU and US states is 11,478,157 and the mean 29,970,243.
Caveats
- Travel data is from 2017.
- All figures are rounded to the nearest hundredth.
Details
Only six states have more than 100 million air travelers (in descending order of travelers): the United Kingdom, Germany, Spain, France, Italy, and California. An additional 38 states (23 US, 15 EU) have over 10 million air passengers. A further 27 have over 1 million (19 US, 8 EU), and the remaining seven - all of which are from the US - have less than a million (including Delaware which has none).
At first glance, it may seem surprising to see EU states utilize air travel more than US states do, as the EU also utilizes high-speed rail. However, the EU has a larger population than the US does. The next series of posts will look into whether this is a significant reason for this discrepancy in air travel between the two superstates.
Sources
Eurostat. 2018. "Air Passenger Transport by Reporting Country." Accessed December 12, 2018. http://appsso.eurostat.ec.europa.eu/nui/show.do?query=BOOKMARK_DS-054020_QID_63F2F729_UID_-3F171EB0&layout=TIME,C,X,0;GEO,L,Y,0;UNIT,L,Z,0;TRA_MEAS,L,Z,1;SCHEDULE,L,Z,2;TRA_COV,L,Z,3;INDICATORS,C,Z,4;&zSelection=DS-054020TRA_COV,TOTAL;DS-054020SCHEDULE,TOT;DS-054020UNIT,PAS;DS-054020INDICATORS,OBS_FLAG;DS-054020TRA_MEAS,PAS_CRD;&rankName1=UNIT_1_2_-1_2&rankName2=INDICATORS_1_2_-1_2&rankName3=SCHEDULE_1_2_-1_2&rankName4=TRA-COV_1_2_-1_2&rankName5=TRA-MEAS_1_2_-1_2&rankName6=TIME_1_0_0_0&rankName7=GEO_1_2_0_1&sortC=ASC_-1_FIRST&rStp=&cStp=&rDCh=&cDCh=&rDM=true&cDM=true&footnes=false&empty=false&wai=false&time_mode=NONE&time_most_recent=false&lang=EN&cfo=%23%23%23%2C%23%23%23.%23%23%23.
Federal Aviation Authority. 2018. "Enplanements of All Commercial Service Airports (by Rank)." Accessed November 26, 2018. https://www.faa.gov/airports/planning_capacity/passenger_allcargo_stats/passenger/media/cy17-commercial-service-enplanements.pdf.