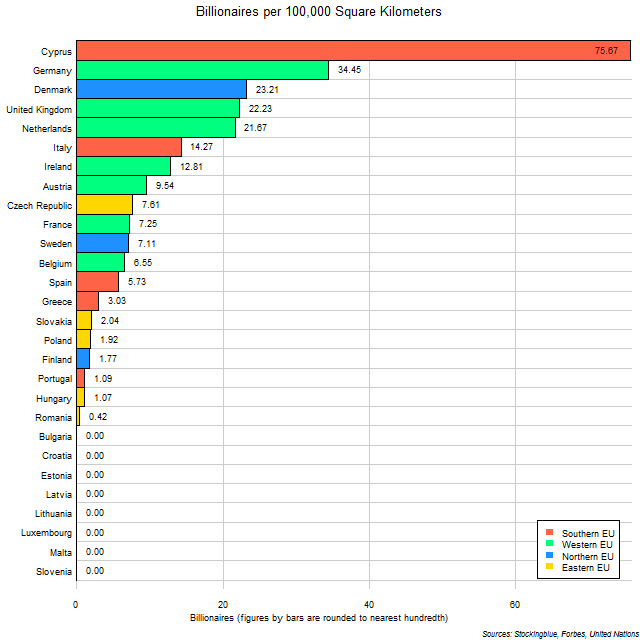
The chart above shows the number of billionaires per 100,000 square kilometers (38,610 square miles) in each EU state. Cyprus is the only state where there are more than five billionaires for every 10,000 square kilometers (3,861 square miles).
Findings
- The difference between the state with the highest billionaire density, Cyprus, and the state with the lowest (that has billionaires), Romania, is 75.25 billionaires per 100,000 square kilometers.
- Cyprus has 180.38 times the billionaires per area that Romania does.
- Bulgaria, Croatia, Estonia, Latvia, Lithuania, Luxembourg, Malta, and Slovenia do not have a single billionaire.
Caveats
- Data is from 2018.
- Rates are rounded to the nearest hundredth.
Details
The Southern, Western, and Northern EU each have a state in the top three. The highest ranked Eastern EU state, the Czech Republic, is ranked ninth. Also, not a single Eastern EU state has more than one billionaire for every 10,000 square kilometers. The only seven states to have more than on billionaire for every 10,000 square kilometers are: Cyprus, Germany, Denmark, the United Kingdom, the Netherlands, Italy, and Ireland.
Germany is the only state to rank in the top five in total billionaires, billionaires per capita, and billionaire density. Austria, Ireland, Italy, the United Kingdom, Denmark, and Germany are the only six states to rank in the top ten in all three metrics. Cyprus, which ranks first in this metric, ranks 11th in total billionaires and first in billionaires per capita. Germany, which ranks first in total billionaires, ranks second in this metric and fifth in per capita billionaires.
Sources
Forbes. 2018. "The World's Billionaires List." Accessed October 2, 2018. https://www.forbes.com/billionaires/list/21/#version:static.
United Nations. 2007. "United Nations Statistics Division - Environment Statistics." Accessed January 23, 2018. https://unstats.un.org/unsd/environment/totalarea.htm.