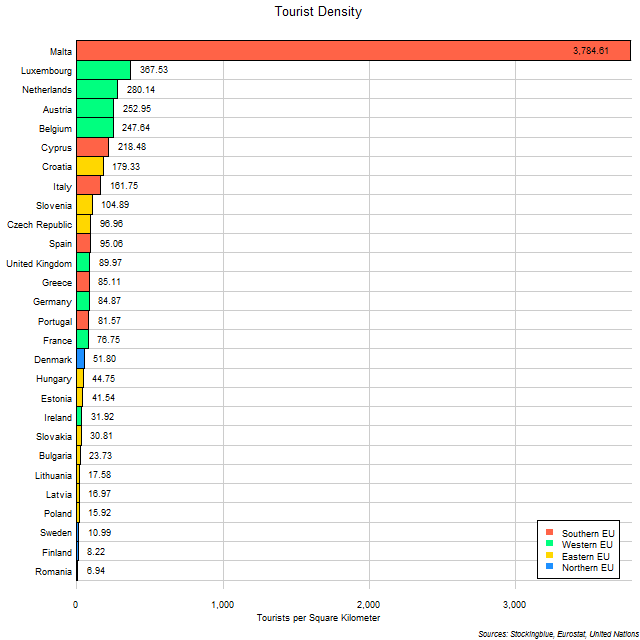
The chart above shows the number of tourists per square kilometer that visited each EU state in 2012. Malta has, by a huge margin, the most tourists per square kilometer of territory than any other state.
Findings
- The difference between the state with the most international tourists per square kilometer, Malta, and the state with the least, Romania, is 3,777.68 tourists per square kilometer.
- Malta has 545.69 times the international tourists per square kilometer that Romania does.
- The median number of international tourists per square kilometer in the 28 EU states is 83.22 and the mean 232.46.
- Only nine states had a tourist density of over 100 visitors per square kilometer (in descending order of density): Malta, Luxembourg, Netherlands, Austria, Belgium, Cyprus, Croatia, Italy, and Slovenia.
Caveats
- Tourist data is from 2012 except for Ireland which is from 2014.
- All figures are rounded to the nearest hundredth.
Details
Austria, Croatia, and Italy are the only states to be ranked in the top ten in total tourists, per capita tourists, and tourists per area.
Of the seven states whose area is larger than 250,000 square kilometers Italy ranks first followed by (in descending order of tourist density): Spain, Germany, France, Poland, Sweden, and Finland.
Of the four states whose area is smaller than 25,000 square kilometers Malta ranks first followed by (in descending order of tourist density): Luxembourg, Cyprus, and Slovenia.
Sources
Eurostat. 2018. "Arrivals at Tourist Accommodation Establishments." Accessed September 18, 2018. http://appsso.eurostat.ec.europa.eu/nui/show.do?query=BOOKMARK_DS-055748_QID_740A02AF_UID_-3F171EB0&layout=TIME,C,X,0;GEO,L,Y,0;C_RESID,L,Z,0;UNIT,L,Z,1;NACE_R2,L,Z,2;INDICATORS,C,Z,3;&zSelection=DS-055748NACE_R2,I551-I553;DS-055748C_RESID,FOR;DS-055748UNIT,NR;DS-055748INDICATORS,OBS_FLAG;&rankName1=C-RESID_1_2_-1_2&rankName2=UNIT_1_2_-1_2&rankName3=INDICATORS_1_2_-1_2&rankName4=NACE-R2_1_2_-1_2&rankName5=TIME_1_0_0_0&rankName6=GEO_1_2_0_1&sortC=ASC_-1_FIRST&rStp=&cStp=&rDCh=&cDCh=&rDM=true&cDM=true&footnes=false&empty=false&wai=false&time_mode=NONE&time_most_recent=false&lang=EN&cfo=%23%23%23%2C%23%23%23.%23%23%23.
United Nations. 2007. "United Nations Statistics Division - Environment Statistics." Accessed January 23, 2018. https://unstats.un.org/unsd/environment/totalarea.htm.