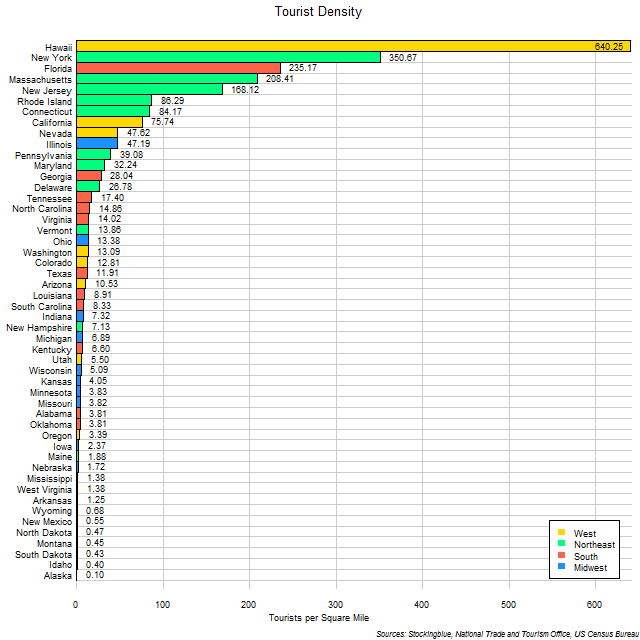
The chart above shows the number of tourists per square mile that visited each US state in 2012. Hawaii has, by a large margin, the most tourists per square mile of territory than any other state.
Findings
- The difference between the state with the most international tourists per square mile, Hawaii, and the state with the least, Alaska, is 640.15 tourists per square mile.
- Hawaii has 6,391.06 times the international tourists per square mile that Alaska does.
- The median number of international tourists per square mile in the 50 US states is 7.82 and the mean 45.66.
- Only five states had a tourist density of over 100 visitors per square mile (in descending order of density): Hawaii, New York, Florida, Massachusetts, and New Jersey.
Caveats
- Tourist data is from 2012.
- All figures are rounded to the nearest hundredth.
Details
Florida, Hawaii, and New York are the only states to be ranked in the top five in total tourists, per capita tourists, and tourists per area.
Of the eight states whose area is larger than 100,000 square miles California ranks first followed by (in descending order of tourist density): Nevada, Colorado, Texas, Arizona, New Mexico, Montana, and Alaska.
Of the six states whose area is smaller than 10,000 square miles New Jersey ranks first followed by (in descending order of tourist density): Rhode Island, Connecticut, Delaware, Vermont, and New Hampshire.
Sources
National Trade and Tourism Office. 2018. "International Visitation in the United States." Accessed September 18, 2018. https://travel.trade.gov/outreachpages/inbound.general_information.inbound_overview.html.
National Trade and Tourism Office. 2018. "Survey of International Air Travelers." Accessed September 18, 2018. https://travel.trade.gov/research/programs/ifs/examples.asp.
United States Census Bureau. September 2012. "United States Summary: 2010: Population and Housing Unit Counts." Accessed January 23, 2018. https://www.census.gov/prod/cen2010/cph-2-1.pdf.