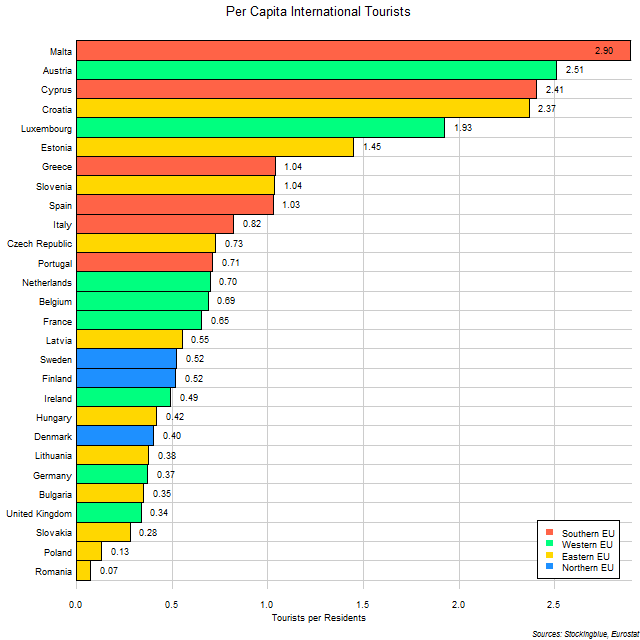
The chart above shows the number of tourists per resident that visited each EU state in 2012. Malta receives nearly three times its population in international tourists per year, although it does help to have a small population as the base figure. Of all the states that receive more than 1.5 times their population in tourists annually, only Austria has a sizable population to begin with.
Findings
- The difference between the state with the most international tourists per capita, Malta, and the state with the least, Romania, is 2.82.
- Malta has 39.29 times the per capita international tourists that Romania does.
- The median number of international tourists in the 28 EU states is 0.67 and the mean 0.92.
- Nine states received more international tourists than their population: Malta, Austria, Cyprus, Croatia, Luxembourg, Estonia, Greece, Slovenia, and Spain.
Caveats
- Tourist data is from 2012 except for Ireland which is from 2014.
- All figures are rounded to the nearest hundredth.
Details
Austria is the only populous state to receive 1.5 times its population in tourists. It's good to have a population and economic behemoth that as a neighbor.
Even though Malta tops the chart in this metric, when it comes to overall international tourists, they are fourth from the bottom. Austria, Croatia, Greece, Italy, and Spain are the only states to be in the top ten in both overall international tourists and per capita international tourists. These same states, excluding Italy, also have at least 10 million residents and more tourists than residents.
Sources
Eurostat. 2018. "Arrivals at Tourist Accommodation Establishments." Accessed September 18, 2018. http://appsso.eurostat.ec.europa.eu/nui/show.do?query=BOOKMARK_DS-055748_QID_740A02AF_UID_-3F171EB0&layout=TIME,C,X,0;GEO,L,Y,0;C_RESID,L,Z,0;UNIT,L,Z,1;NACE_R2,L,Z,2;INDICATORS,C,Z,3;&zSelection=DS-055748NACE_R2,I551-I553;DS-055748C_RESID,FOR;DS-055748UNIT,NR;DS-055748INDICATORS,OBS_FLAG;&rankName1=C-RESID_1_2_-1_2&rankName2=UNIT_1_2_-1_2&rankName3=INDICATORS_1_2_-1_2&rankName4=NACE-R2_1_2_-1_2&rankName5=TIME_1_0_0_0&rankName6=GEO_1_2_0_1&sortC=ASC_-1_FIRST&rStp=&cStp=&rDCh=&cDCh=&rDM=true&cDM=true&footnes=false&empty=false&wai=false&time_mode=NONE&time_most_recent=false&lang=EN&cfo=%23%23%23%2C%23%23%23.%23%23%23.
Eurostat. 2017. "Population on 1 January by Age Groups and Sex - Functional Urban Areas." Accessed December 11, 2017. http://appsso.eurostat.ec.europa.eu/nui/show.do?dataset=urb_lpop1&lang=en.