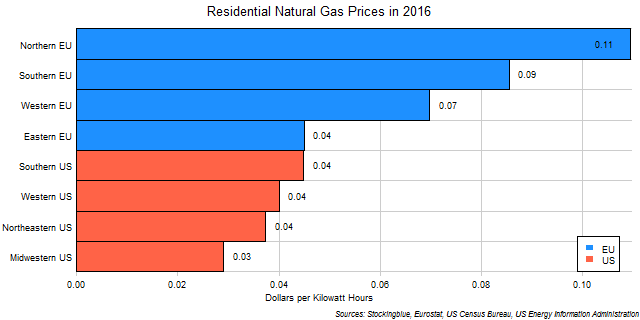
The chart above shows the residential cost of natural gas per kilowatt hour in US dollars for each EU and US region in 2016. Every single EU region has more costly residential natural gas than every single US region.
Findings
- The difference between the region with the most expensive residential natural gas, the Northern EU, and the region with the cheapest, the Midwestern US, is $0.08.
- The Northern EU has 3.77 times the residential natural gas prices that the Midwestern US does.
Caveats
- All figures are rounded to the nearest hundredth.
- EU and US data come from different sources.
- Cyprus, Finland, and Malta are not included in the list as Cyprus and Malta do not have a residential natural gas grid, and Finland has a very small one in a limited geographic area.
- EU data was converted from euros to dollars at the average 2016 0.90 euros to dollars rate and the 2017 0.88 euros to dollars rate.
- The Northern EU consists of Sweden, Denmark, and Finland.
- The Southern EU consists of Italy, Spain, Portugal, Greece, Cyprus, and Malta.
- The Western EU consists of Germany, United Kingdom, France, Netherlands, Belgium, Austria, Ireland, and Luxembourg.
- The Eastern EU consists of Poland, Czech Republic, Romania, Hungary, Slovakia, Bulgaria, Croatia, Slovenia, Lithuania, Latvia, and Estonia.
- The Southern US consists of Texas, Florida, Georgia, North Carolina, Virginia, Tennessee, Louisiana, South Carolina, Alabama, Kentucky, Oklahoma, Arkansas, Mississippi, and West Virginia.
- The Western US consists of California, Washington, Colorado, Arizona, Oregon, Utah, Nevada, New Mexico, Hawaii, Idaho, Alaska, Montana, and Wyoming.
- The Northeastern US consists of New York, Pennsylvania, New Jersey, Massachusetts, Maryland, Connecticut, New Hampshire, Delaware, Maine, Rhode Island, and Vermont.
- The Midwestern US consists of Illinois, Ohio, Michigan, Indiana, Minnesota, Wisconsin, Missouri, Iowa, Kansas, Nebraska, North Dakota, and South Dakota.
Details
It makes sense that every EU region has costlier residential natural gas when 16 out of the 20 states with the priciest residential natural gas are from the EU and the 26 cheapest states are all from the US.
The next series of posts will look into the proportion of per capita GDP that residential natural gas prices make up.
Sources
Eurostat. 2017. "Population on 1 January by Age Groups and Sex - Functional Urban Areas." Accessed December 11, 2017. http://appsso.eurostat.ec.europa.eu/nui/show.do?dataset=urb_lpop1&lang=en.
Eurostat. 2018. "Gas Prices for Household Consumers - Bi-Annual Data (from 2007 Onwards)." Accessed September 6, 2018. http://appsso.eurostat.ec.europa.eu/nui/show.do?query=BOOKMARK_DS-052776_QID_11386210_UID_-3F171EB0&layout=TIME,C,X,0;GEO,L,Y,0;PRODUCT,L,Z,0;CONSOM,L,Z,1;UNIT,L,Z,2;TAX,L,Z,3;CURRENCY,L,Z,4;INDICATORS,C,Z,5;&zSelection=DS-052776PRODUCT,4100;DS-052776UNIT,KWH;DS-052776CURRENCY,EUR;DS-052776INDICATORS,OBS_FLAG;DS-052776CONSOM,4141902;DS-052776TAX,X_TAX;&rankName1=TIME_1_0_0_0&rankName2=TAX_1_2_-1_2&rankName3=UNIT_1_2_-1_2&rankName4=GEO_1_2_0_1&rankName5=CURRENCY_1_2_-1_2&rankName6=CONSOM_1_2_-1_2&rankName7=INDICATORS_1_2_-1_2&rankName8=PRODUCT_1_2_-1_2&sortC=ASC_-1_FIRST&rStp=&cStp=&rDCh=&cDCh=&rDM=true&cDM=true&footnes=false&empty=false&wai=false&time_mode=NONE&time_most_recent=false&lang=EN&cfo=%23%23%23%2C%23%23%23.%23%23%23.
United States Census Bureau. "Annual Estimates of the Resident Population: April 1, 2010 to July 1, 2016." Accessed December 12, 2017. http://factfinder2.census.gov.
US Energy Information Administration. 2018. "US Natural Gas Prices." Accessed September 6, 2018. https://www.eia.gov/dnav/ng/ng_pri_sum_dcu_nus_a.htm.