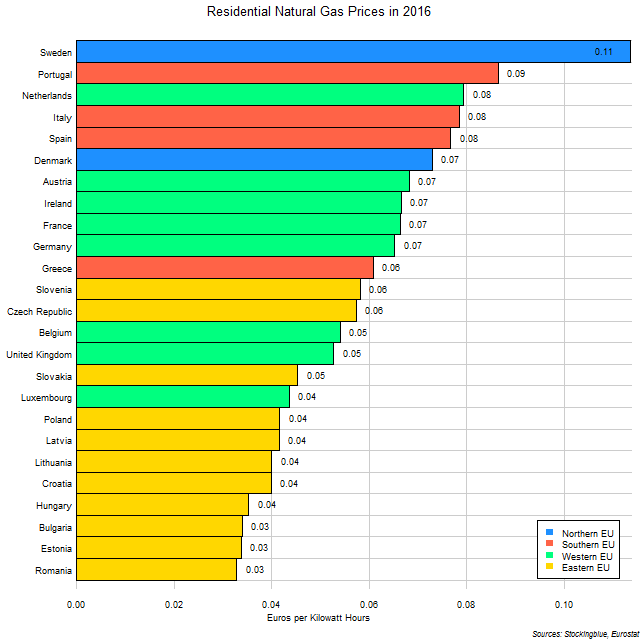
The chart above shows the residential cost of natural gas per kilowatt hour for each EU state in 2016. Sweden has the most expensive residential natural gas which is interesting seeing as it is a nation that probably needs home heating than most of the other states in the list.
Findings
- The difference between the state with the most expensive residential natural gas, Sweden, and the state with the cheapest, Romania, is €0.08.
- Sweden has 3.47 times the residential natural gas prices that Romania does.
- The median cost of residential natural gas in the 25 EU states (Cyprus, Finland, and Malta are not included due to lack of a significant residential grid) is €0.06 and the mean €0.06.
Caveats
- All figures are rounded to the nearest hundredth.
- Cyprus, Finland, and Malta are not included in the list as Cyprus and Malta do not have a residential natural gas grid, and Finland has a very small one in a limited geographic area.
Details
Luckily for Portugal, they probably do not need to heat their homes as frequently as other states, and the limited demand may be a reason why prices are so high in the state.
Eastern EU states tend to have the lowest prices as does Luxembourg. It may seem odd that a country with such limited demand and so much wealth can wrangle such welcoming costs, but its small geography can be a reason why prices are so low as distribution is a major contributing factor to the price of the commodity.
Sources
Eurostat. 2018. "Gas Prices for Household Consumers - Bi-Annual Data (from 2007 Onwards)." Accessed September 6, 2018. http://appsso.eurostat.ec.europa.eu/nui/show.do?query=BOOKMARK_DS-052776_QID_11386210_UID_-3F171EB0&layout=TIME,C,X,0;GEO,L,Y,0;PRODUCT,L,Z,0;CONSOM,L,Z,1;UNIT,L,Z,2;TAX,L,Z,3;CURRENCY,L,Z,4;INDICATORS,C,Z,5;&zSelection=DS-052776PRODUCT,4100;DS-052776UNIT,KWH;DS-052776CURRENCY,EUR;DS-052776INDICATORS,OBS_FLAG;DS-052776CONSOM,4141902;DS-052776TAX,X_TAX;&rankName1=TIME_1_0_0_0&rankName2=TAX_1_2_-1_2&rankName3=UNIT_1_2_-1_2&rankName4=GEO_1_2_0_1&rankName5=CURRENCY_1_2_-1_2&rankName6=CONSOM_1_2_-1_2&rankName7=INDICATORS_1_2_-1_2&rankName8=PRODUCT_1_2_-1_2&sortC=ASC_-1_FIRST&rStp=&cStp=&rDCh=&cDCh=&rDM=true&cDM=true&footnes=false&empty=false&wai=false&time_mode=NONE&time_most_recent=false&lang=EN&cfo=%23%23%23%2C%23%23%23.%23%23%23.