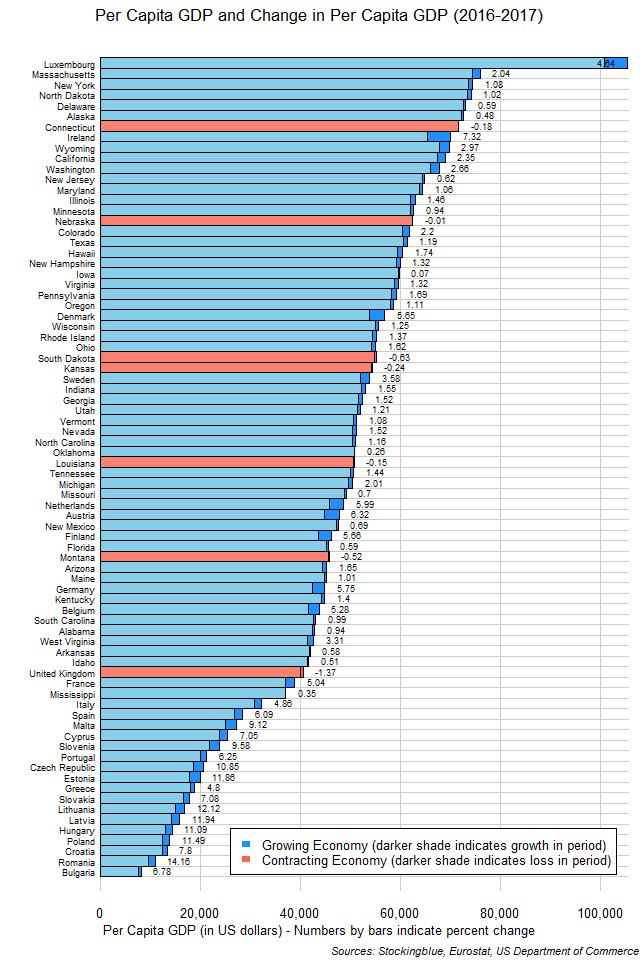
The chart above shows the per capita GDP and change in per capita GDP over the last year in EU and US states in US dollars. Although US states make up eight of the top ten states in per capita GDP, the top state is an EU one, and the top ten growth states as well as growth rate states all come from the EU. The fastest growing US state, Wyoming, comes in 12th with less than half the per capita GDP growth of the fastest growing EU state, Ireland. In addition, the US state with the best growth rate, West Virginia, comes in behind every EU state save for the United Kingdom, with less than one-fourth the growth rate of the leading EU state in the metric, Romania.
Findings
- The difference between the state with the greatest absolute growth in per capita GDP, Ireland, and the state with the least, Iowa, is $4,739.17.
- Ireland has 116.22 times the per capita absolute economic growth that Iowa does in the past year.
- The difference between the state with the greatest growth rate in per capita GDP, Romania, and the state with the least, Iowa, is 14.10 percentage points.
- Romania has 205.58 times the per capita economic growth rate that Iowa does in the past year.
- Seven states saw their per capita GDP decrease in the past year (in decreasing order of contraction): the United Kingdom, South Dakota, Montana, Kansas, Connecticut, Louisiana, and Nebraska.
- Ireland overtook Wyoming, California, and Washington.
- Illinois and Minnesota overtook Nebraska.
- Colorado overtook Texas.
- Hawaii and New Hampshire surpassed Iowa.
- Denmark overtook Wisconsin, Rhode Island, Ohio, South Dakota, and Kansas.
- Wisconsin and Rhode Island surpassed South Dakota.
- Ohio surpassed South Dakota and Kansas.
- Sweden overtook Indiana.
- Vermont surpassed Oklahoma and Louisiana.
- Nevada surpassed North Carolina, Oklahoma, and Louisiana.
- North Carolina surpassed Oklahoma and Louisiana.
- Oklahoma surpassed Louisiana.
- The Netherlands overtook New Mexico.
- Austria overtook New Mexico, Florida, and Montana.
- Finland overtook Florida, Montana, Arizona, Maine, and Kentucky.
- Florida surpassed Montana.
- Arizona surpassed Maine.
- Germany overtook Kentucky, South Carolina, and Alabama.
- Belgium overtook South Carolina, Alabama, and Arkansas.
- West Virginia surpassed Arkansas and Idaho.
- Estonia surpassed Greece.
- Poland surpassed Croatia.
Caveats
- All percentages are rounded to the nearest hundredth.
- EU and US data come from different sources.
- US data was priced in 2009 dollars while the EU data was priced in current euros so the dollars were adjusted to current dollars using the inflation rates at RateInflation.
- EU data was converted from euros to dollars at the average 2016 0.90 euros to dollars rate and the 2017 0.88 euros to dollars rate.
Details
Although US states, on the whole, had higher per capita GDPs than their EU counterparts, not one single US state overtook an EU state in the past year (which stands in contrast to only one EU state overtaking US states in the past ten years - which goes to show what a role fluctuations in currencies play in comparisons such as these).
Finland and Denmark both overtook five states each which was the greatest number of states surpassed in the period.
Seventeen - or more than half of EU states - have a smaller per capita GDP than Mississippi, the US state with the lowest per capita GDP. Eight of those states have a per capita GDP that is less than half of Mississippi's.
The median per capita GDP for the 28 EU states went from $24,333 in 2016 to $26,307 in 2017 while the mean went from $31,091 to $33,024. The median per capita GDP for the 50 US states went from $54,391 in 2016 to $54,952 in 2017 while the mean went from $55,529 to $56,147.
Sources
Eurostat. 2018. "Eurostat - Tables, Graphs and Maps Interface." Accessed August 2, 2018. http://appsso.eurostat.ec.europa.eu/nui/show.do?query=BOOKMARK_DS-420898_QID_-378D3319_UID_-3F171EB0&layout=TIME,C,X,0;GEO,L,Y,0;UNIT,L,Z,0;NA_ITEM,L,Z,1;INDICATORS,C,Z,2;&zSelection=DS-420898INDICATORS,OBS_FLAG;DS-420898UNIT,CP_EUR_HAB;DS-420898NA_ITEM,B1GQ;&rankName1=UNIT_1_2_-1_2&rankName2=INDICATORS_1_2_-1_2&rankName3=NA-ITEM_1_2_-1_2&rankName4=TIME_1_0_0_0&rankName5=GEO_1_2_0_1&sortC=ASC_-1_FIRST&rStp=&cStp=&rDCh=&cDCh=&rDM=true&cDM=true&footnes=false&empty=false&wai=false&time_mode=NONE&time_most_recent=false&lang=EN&cfo=%23%23%23%2C%23%23%23.%23%23%23.
US Department of Commerce. 2018. "US Bureau of Economic Analysis." Accessed June 26, 2018. https://bea.gov/itable/iTable.cfm?ReqID=70&step=1#reqid=70&step=10&isuri=1&7003=1000&7035=-1&7004=naics&7005=1&7006=01000,02000,04000,05000,06000,08000,09000,10000,11000,12000,13000,15000,16000,17000,18000,19000,20000,21000,22000,23000,24000,25000,26000,27000,28000,29000,30000,31000,32000,33000,34000,35000,36000,37000,38000,39000,40000,41000,42000,44000,45000,46000,47000,48000,49000,50000,51000,53000,54000,55000,56000&7036=-1&7001=11000&7002=1&7090=70&7007=2017,2016,2015,2014,2013,2012,2011,2010,2009,2008,2007,2006&7093=levels.