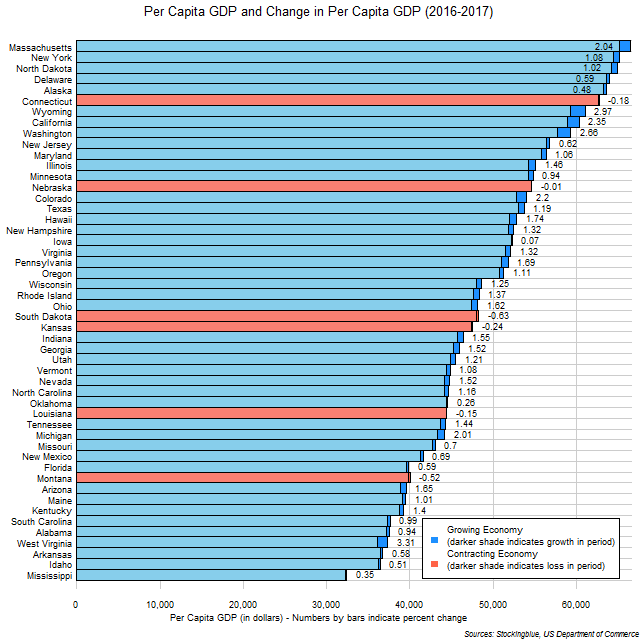
The chart above shows the per capita GDP and change in per capita GDP over the last year in US states. Only six states witnessed a contraction in their per capita GDP in the past year, while Wyoming had the greatest growth in the metric and West Virginia had the greatest growth rate.
Findings
- The difference between the state with the greatest absolute growth in per capita GDP, Wyoming, and the state with the least, Iowa, is $1,728.
- Wyoming has 49.00 times the per capita absolute economic growth that Iowa does in the past year.
- The difference between the state with the greatest growth rate in per capita GDP, West Virginia, and the state with the least, Iowa, is 3.24 percentage points.
- West Virginia has 48.09 times the per capita economic growth rate that Iowa does in the past year.
- Only six states' per capita GDP shrank last year (in decreasing order of contraction): South Dakota, Montana, Kansas, Connecticut, Louisiana, and Nebraska.
- Illinois and Minnesota surpassed Nebraska.
- Colorado surpassed Texas.
- Hawaii and New Hampshire surpassed Iowa.
- Wisconsin and Rhode Island surpassed South Dakota.
- Ohio surpassed South Dakota and Kansas.
- Vermont surpassed Oklahoma and Louisiana.
- Nevada surpassed North Carolina, Oklahoma, and Louisiana.
- North Carolina surpassed Oklahoma and Louisiana.
- Oklahoma surpassed Louisiana.
- Florida surpassed Montana.
- Arizona surpassed Maine.
- West Virginia surpassed Arkansas and Idaho.
Caveats
- All percentages are rounded to the nearest hundredth.
Details
Nevada surpassed the most states in per capita GDP last year. It overtook three states: North Carolina, Oklahoma, and Louisiana.
Thirty-five states did not overtake any other states in per capita GDP last year.
The median per capita GDP for the 50 US states went from $47,605 in 2016 to $48,096 in 2017 while the mean went from $48,600 to $49,142.
Sources
US Department of Commerce. 2018. "US Bureau of Economic Analysis." Accessed June 26, 2018. https://bea.gov/itable/iTable.cfm?ReqID=70&step=1#reqid=70&step=10&isuri=1&7003=1000&7035=-1&7004=naics&7005=1&7006=01000,02000,04000,05000,06000,08000,09000,10000,11000,12000,13000,15000,16000,17000,18000,19000,20000,21000,22000,23000,24000,25000,26000,27000,28000,29000,30000,31000,32000,33000,34000,35000,36000,37000,38000,39000,40000,41000,42000,44000,45000,46000,47000,48000,49000,50000,51000,53000,54000,55000,56000&7036=-1&7001=11000&7002=1&7090=70&7007=2017,2016,2015,2014,2013,2012,2011,2010,2009,2008,2007,2006&7093=levels.