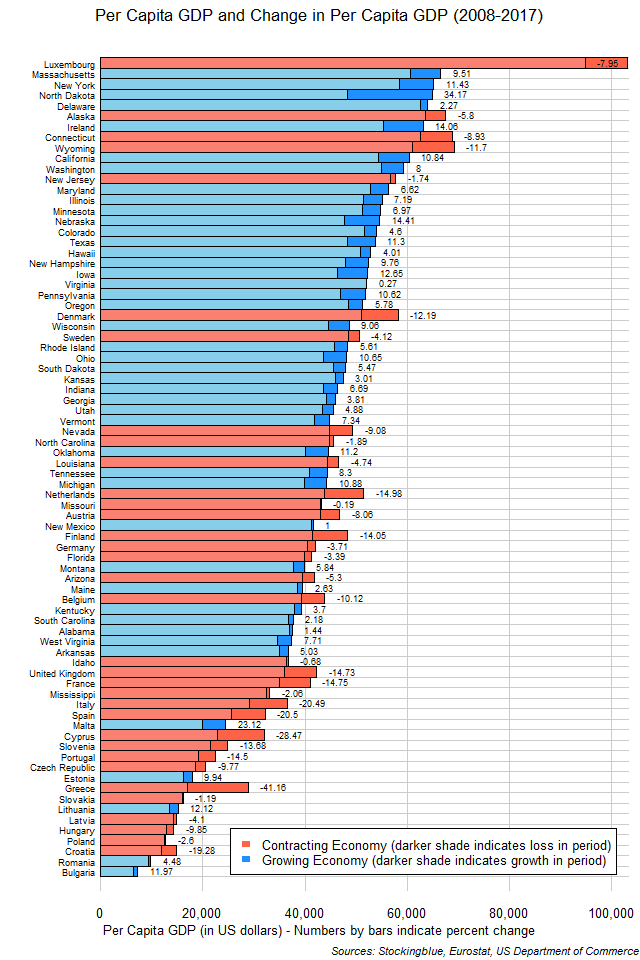
The chart above shows the per capita GDP and change in per capita GDP over the last ten years in EU and US states in US dollars. Luxembourg continues to maintain the highest per capita GDP of all EU and US states by far. However, there are only two other EU states in the top 25 (out of 78): Ireland with the eighth highest per capita GDP and Denmark with the 25th.
Findings
- The difference between the state with the greatest absolute growth in per capita GDP, North Dakota, and the state with the least, Virginia, is $16,393.
- North Dakota has 118.94 times the per capita absolute economic growth that Virginia does in the past ten years.
- The difference between the state with the greatest growth rate in per capita GDP, North Dakota, and the state with the least, Virginia, is 33.90 percentage points.
- North Dakota has 127.80 times the per capita economic growth rate that Virginia does in the past ten years.
- Only six (out of 28) EU states' per capita GDP grew in the ten year period when priced in US dollars (in decreasing order of growth rate): Malta, Ireland, Lithuania, Bulgaria, Estonia, and Romania.
- Conversely, only 12 (out of 50) US states' per capita GDP shrank in the ten year period when priced in US dollars (in decreasing order of contraction): Wyoming, Nevada, Connecticut, Alaska, Arizona, Louisiana, Florida, Mississippi, North Carolina, New Jersey, Idaho, and Missouri.
- Mississippi was the US state with the lowest per capita GDP both in 2008 and 2017. There were 16 EU countries with a lower per capita GDP in 2008 (in descending order of per capita GDP): Spain, Cyprus, Greece, Slovenia, Portugal, Czech Republic, Malta, Estonia, Slovakia, Latvia, Croatia, Hungary, Lithuania, Poland, Romania, and Bulgaria. In the ten year period, Italy was added to the list.
- Only one EU state surpassed US states in the ten year period. That state was Ireland and it overtook Connecticut, Wyoming, New Jersey, and Denmark. All other changes in rank were either US states overtaking EU states, US states surpassing US states, or EU states surpassing EU states.
Caveats
- All percentages are rounded to the nearest hundredth.
- EU and US data come from different sources.
- US data was priced in 2009 dollars while the EU data was priced in current euros so the euros were adjusted to 2009 euros using the inflation rates at RateInflation.
- EU data was converted from euros to dollars at the average 2008 0.68 euros to dollars rate and the 2017 0.88 euros to dollars rate.
Details
North Dakota surpassed the most states in per capita GDP in the ten year period. It overtook 19 states: Delaware, Alaska, Ireland, Connecticut, Wyoming, California, Washington, New Jersey, Maryland, Illinois, Minnesota, Colorado, Hawaii, Virginia, Oregon, Denmark, Sweden, Nevada, and the Netherlands.
Oklahoma surpassed the second greatest number of states in per capita GDP in the ten year period. It overtook 13 states: Louisiana, Tennessee, the Netherlands, Missouri, Austria, New Mexico, Finland, Germany, Florida, Arizona, Belgium, the United Kingdom, and France.
Sixteen states did not overtake any states at all in the ten-year period: Luxembourg (which had no states to surpass as it had the highest per capita GDP), Wyoming, Denmark, the Netherlands, Finland, Belgium, the United Kingdom, France, Italy, Spain, Cyprus, Greece, Slovakia, Croatia, Romania, and Bulgaria.
The median per capita GDP for the 28 EU states went from $30,445 in 2008 to $23,679 in 2017 while the mean went from $32,804 to $29,725. The median per capita GDP for the 50 US states went from $45,898 in 2008 to $48,096 in 2017 while the mean went from $47,076 to $49,142.
Sources
Eurostat. 2018. "Eurostat - Tables, Graphs and Maps Interface." Accessed August 2, 2018. http://appsso.eurostat.ec.europa.eu/nui/show.do?query=BOOKMARK_DS-420898_QID_-378D3319_UID_-3F171EB0&layout=TIME,C,X,0;GEO,L,Y,0;UNIT,L,Z,0;NA_ITEM,L,Z,1;INDICATORS,C,Z,2;&zSelection=DS-420898INDICATORS,OBS_FLAG;DS-420898UNIT,CP_EUR_HAB;DS-420898NA_ITEM,B1GQ;&rankName1=UNIT_1_2_-1_2&rankName2=INDICATORS_1_2_-1_2&rankName3=NA-ITEM_1_2_-1_2&rankName4=TIME_1_0_0_0&rankName5=GEO_1_2_0_1&sortC=ASC_-1_FIRST&rStp=&cStp=&rDCh=&cDCh=&rDM=true&cDM=true&footnes=false&empty=false&wai=false&time_mode=NONE&time_most_recent=false&lang=EN&cfo=%23%23%23%2C%23%23%23.%23%23%23.
US Department of Commerce. 2018. "US Bureau of Economic Analysis." Accessed June 26, 2018. https://bea.gov/itable/iTable.cfm?ReqID=70&step=1#reqid=70&step=10&isuri=1&7003=1000&7035=-1&7004=naics&7005=1&7006=01000,02000,04000,05000,06000,08000,09000,10000,11000,12000,13000,15000,16000,17000,18000,19000,20000,21000,22000,23000,24000,25000,26000,27000,28000,29000,30000,31000,32000,33000,34000,35000,36000,37000,38000,39000,40000,41000,42000,44000,45000,46000,47000,48000,49000,50000,51000,53000,54000,55000,56000&7036=-1&7001=11000&7002=1&7090=70&7007=2017,2016,2015,2014,2013,2012,2011,2010,2009,2008,2007,2006&7093=levels.