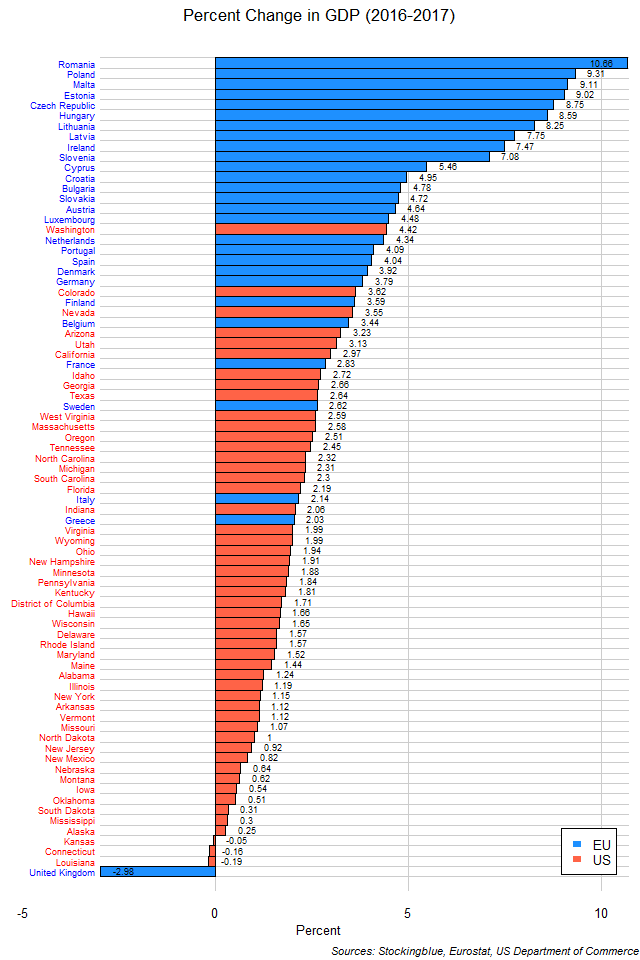
The chart above shows change in GDP over the last year in EU and US states. The 16 fastest growing states last year were all in the EU. The fastest growing US state ranks 17th overall. However, the state with the largest contraction is also from the EU (although not for long).
Findings
- The difference between the state with the greatest growth in GDP, Romania, and the state with the least, Alaska, is 10.41 percentage points.
- Romania has 42.40 times the economic growth that Alaska does in the past year.
- The mean economic growth for the 50 US states and the District of Columbia is 1.71 percent and the median is also 1.71 percent.
- The mean economic growth for the 28 EU states is 5.32 percent and the median is 4.68 percent.
- The mean economic growth for the 78 EU and US states and DC is 2.99 percent and the median is 2.31 percent.
Caveats
- All figures are rounded to the nearest hundredth.
- EU and US data come from different sources.
Details
Aside from the UK, Kansas, Connecticut, and Louisiana are the only other states whose economy contracted in the past year. The worst performing states overwhelmingly are American (33 out of the bottom 34) with the UK holding the worst spot. The next worst EU country is Greece (35th worst). The only states to have the 10 best growth records in the past year and the past decade are Malta, Ireland, Estonia, and Romania.
The European Union as a whole has 2.83 percent growth over the same one year period ranking it just under France and above Idaho. The United States as a whole has 2.07 percent growth over the same one year period ranking it under Italy and just above Indiana.
Sources
Eurostat. 2018. "Eurostat - Tables, Graphs and Maps Interface." Accessed June 26, 2018. http://ec.europa.eu/eurostat/tgm/table.do?tab=table&init=1&language=en&pcode=tec00001&plugin=1.
US Department of Commerce. 2018. "US Bureau of Economic Analysis." Accessed June 26, 2018. https://bea.gov/itable/iTable.cfm?ReqID=70&step=1#reqid=70&step=10&isuri=1&7003=1000&7035=-1&7004=naics&7005=1&7006=01000,02000,04000,05000,06000,08000,09000,10000,11000,12000,13000,15000,16000,17000,18000,19000,20000,21000,22000,23000,24000,25000,26000,27000,28000,29000,30000,31000,32000,33000,34000,35000,36000,37000,38000,39000,40000,41000,42000,44000,45000,46000,47000,48000,49000,50000,51000,53000,54000,55000,56000&7036=-1&7001=11000&7002=1&7090=70&7007=2017,2016,2015,2014,2013,2012,2011,2010,2009,2008,2007,2006&7093=levels.