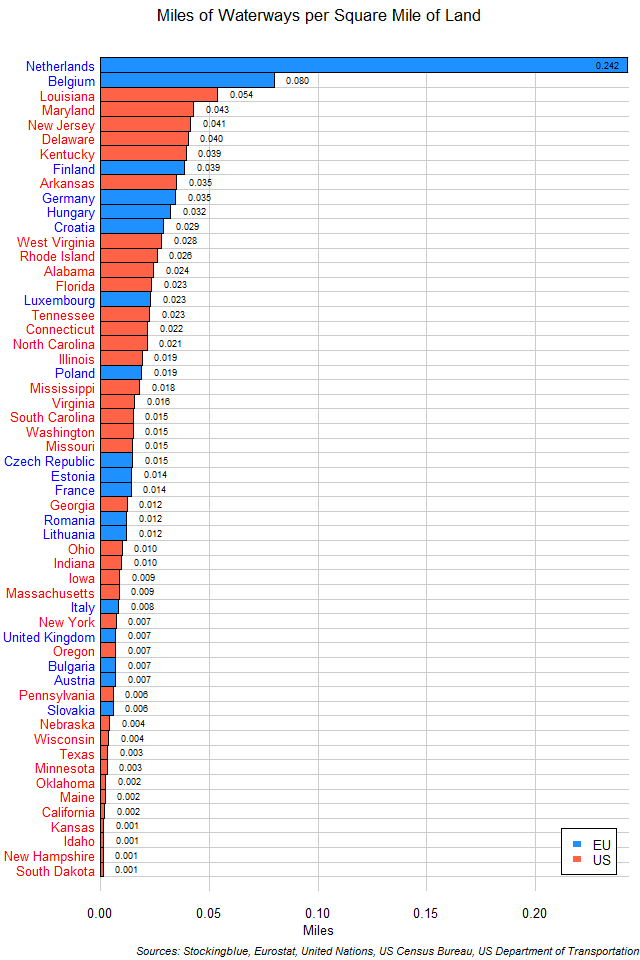
The chart above shows the miles of waterways per square mile of land in EU and US states. The Netherlands has the greatest waterway coverage in the EU and the US by so much that it takes the sum of the next five states to rival the Netherlands' waterway coverage.
Findings
- The difference between the state with the greatest waterway coverage, the Netherlands, and the state with the least, South Dakota, is 0.24 miles.
- The Netherlands has 233.70 times the waterway coverage that South Dakota does.
- Only the Netherlands has more than 0.1 miles of waterways for every square mile of land.
Caveats
- EU waterway data is from 2016 except for Belgium (2008), Germany (2013), Luxembourg (2009), and Romania (2015). US waterway data is from 2013.
- EU area data is from 2007. US area data is from 2010.
- Waterway and area data come from different sources.
- EU and US data come from different sources.
- All figures are rounded to the nearest thousandth.
- Cyprus, Denmark, Greece, Ireland, Latvia, Malta, Portugal, Slovenia, Spain, and Sweden from the EU and Alaska, Arizona, Colorado, Hawaii, Michigan, Montana, Nevada, New Mexico, North Dakota, Utah, Vermont, and Wyoming from the US did not have any waterway data.
Details
Just like in total waterways, EU states take the lead in this metric.
The European Union as a whole has 0.022 miles of waterways for every square mile of land ranking it just under Tennessee and above Connecticut. The United States as a whole has 0.011 miles of waterways for every square mile of land ranking it just under Lithuania and just above Ohio.
Sources
United Nations. 2007. "United Nations Statistics Division - Environment Statistics." Accessed January 23, 2018. https://unstats.un.org/unsd/environment/totalarea.htm.
United States Census Bureau. "Annual Estimates of the Resident Population: April 1, 2010 to July 1, 2016." Accessed December 12, 2017. http://factfinder2.census.gov.
United States Department of Transportation. 2015. "State Transportation by the Numbers." Accessed March 21, 2018. https://www.bts.gov/sites/bts.dot.gov/files/legacy/_entire.pdf.