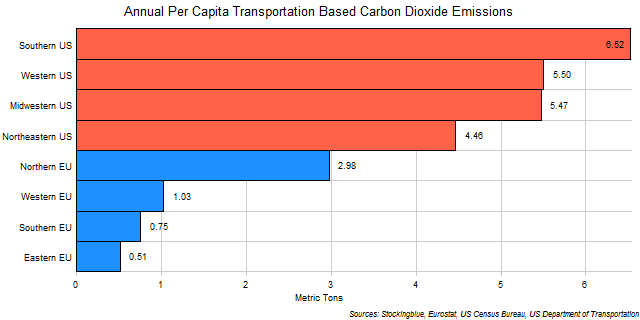
The chart above shows transportation-based carbon dioxide emissions broken down by population in EU and US regions. Every single US region emits more transportation-based carbon dioxide per capita than any EU region.
Findings
- The difference between the region with the most per capita emissions, the Southern US, and the region with the least, the Eastern EU, is 6.02 metric tons.
- The Southern US emits 12.81 times the per capita carbon dioxide that the Eastern EU does.
- Every single US region emits more than four metric tons per capita while every single EU region emits less than three.
Caveats
- EU population data is from 2011; US population data is from 2010.
- EU and US emissions data is from 2013.
- All figures are rounded to the nearest hundredth.
- US population and emissions data come from different sources.
- EU and US data come from different sources.
- The road network is very limited in Alaska, so much so that the state capital is not connected by road, and one in 78 people are pilots.
- The Southern US consists of Texas, Florida, Georgia, North Carolina, Virginia, Tennessee, Louisiana, South Carolina, Alabama, Kentucky, Oklahoma, Arkansas, Mississippi, and West Virginia.
- The Western US consists of California, Washington, Colorado, Arizona, Oregon, Utah, Nevada, New Mexico, Hawaii, Idaho, Alaska, Montana, and Wyoming.
- The Midwestern US consists of Illinois, Ohio, Michigan, Indiana, Minnesota, Wisconsin, Missouri, Iowa, Kansas, Nebraska, North Dakota, and South Dakota.
- The Northeastern US consists of New York, Pennsylvania, New Jersey, Massachusetts, Maryland, Connecticut, New Hampshire, Delaware, Maine, Rhode Island, and Vermont.
- The Northern EU consists of Sweden, Denmark, and Finland.
- The Western EU consists of Germany, United Kingdom, France, Netherlands, Belgium, Austria, Ireland, and Luxembourg.
- The Southern EU consists of Italy, Spain, Portugal, Greece, Cyprus, and Malta.
- The Eastern EU consists of Poland, Czech Republic, Romania, Hungary, Slovakia, Bulgaria, Croatia, Slovenia, Lithuania, Latvia, and Estonia.
Details
It is no surprise to see all US regions emitting more than every single EU region as only three EU states have emissions rates that rival those of US states.
The European Union as a whole emits 0.93 metric tons of carbon dioxide per person from transportation sources annually ranking it just under the Western EU and above the Southern EU. The United States as a whole emits 5.64 metric tons of carbon dioxide per person from transportation sources annually ranking it under the Southern US and just above the Western US.
Sources
Eurostat. 2017. "Data Explorer." Accessed December 11, 2017. http://appsso.eurostat.ec.europa.eu/nui/show.do?dataset=urb_lpop1&lang=en.
Eurostat. 2018. "Eurostat - Data Explorer: Air Emissions Accounts." Accessed April 17, 2018. http://appsso.eurostat.ec.europa.eu/nui/show.do?query=BOOKMARK_DS-286146_QID_2207DEA6_UID_-3F171EB0&layout=TIME,C,X,0;GEO,L,Y,0;AIRPOL,L,Z,0;NACE_R2,L,Z,1;UNIT,L,Z,2;INDICATORS,C,Z,3;&zSelection=DS-286146INDICATORS,OBS_FLAG;DS-286146UNIT,T;DS-286146NACE_R2,H;DS-286146AIRPOL,CO2;&rankName1=UNIT_1_2_-1_2&rankName2=AIRPOL_1_2_-1_2&rankName3=INDICATORS_1_2_-1_2&rankName4=NACE-R2_1_2_-1_2&rankName5=TIME_1_0_0_0&rankName6=GEO_1_2_0_1&sortC=ASC_-1_FIRST&rStp=&cStp=&rDCh=&cDCh=&rDM=true&cDM=true&footnes=false&empty=false&wai=false&time_mode=NONE&time_most_recent=false&lang=EN&cfo=%23%23%23%2C%23%23%23.%23%23%23.
United States Census Bureau. "Annual Estimates of the Resident Population: April 1, 2010 to July 1, 2016." Accessed March 21, 2018. https://factfinder.census.gov/faces/tableservices/jsf/pages/productview.xhtml?pid=PEP_2016_PEPANNRES&src=pt.
United States Department of Transportation. 2015. "State Transportation by the Numbers." Accessed March 21, 2018. https://www.bts.gov/sites/bts.dot.gov/files/legacy/_entire.pdf.