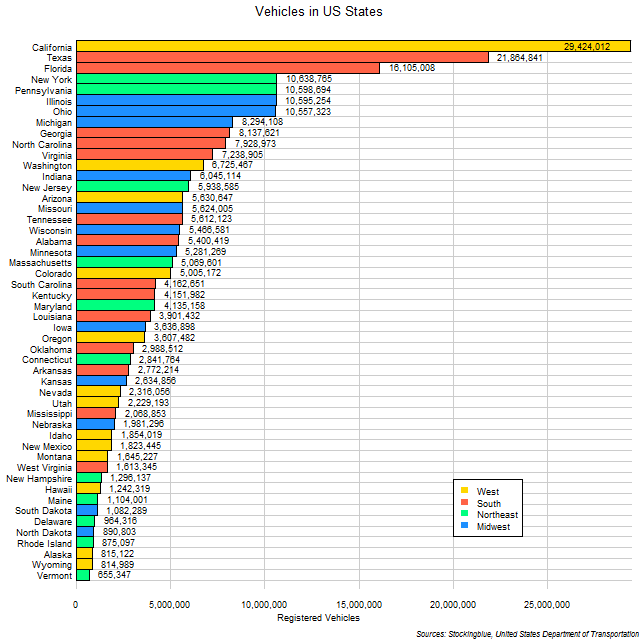
The chart above shows the total number of motor vehicles in US states. It is no surprise that California is the leading state in this metric.
Findings
- The difference between the state with the most vehicles, California, and the state with the least, Vermont, is 28,768,665 vehicles.
- California has 45 times the number of motor vehicles that Vermont does.
- At first glance, the data seems to correlate with population and even GDP.
- Only seven states have over 10 million vehicles registered.
- Half the states have over 4 million vehicles registered and the other half under 4 million.
- The mean is 5,265,746 and the median 4,018,295.
Caveats
- The data is from 2015.
- Total vehicles include automobiles, taxis, buses, trucks, and motorcycles of both public and private use.
Details
Only the three leading states register differences of greater than 33% from the state that ranks just under them in vehicle registrations.
The top ten states account for half the vehicles registered in the US.
Sources
United States Department of Transportation. 2018. "Table MV-1 - Highway Statistics 2015." Accessed February 20, 2018. https://www.fhwa.dot.gov/policyinformation/statistics/2015/mv1.cfm.