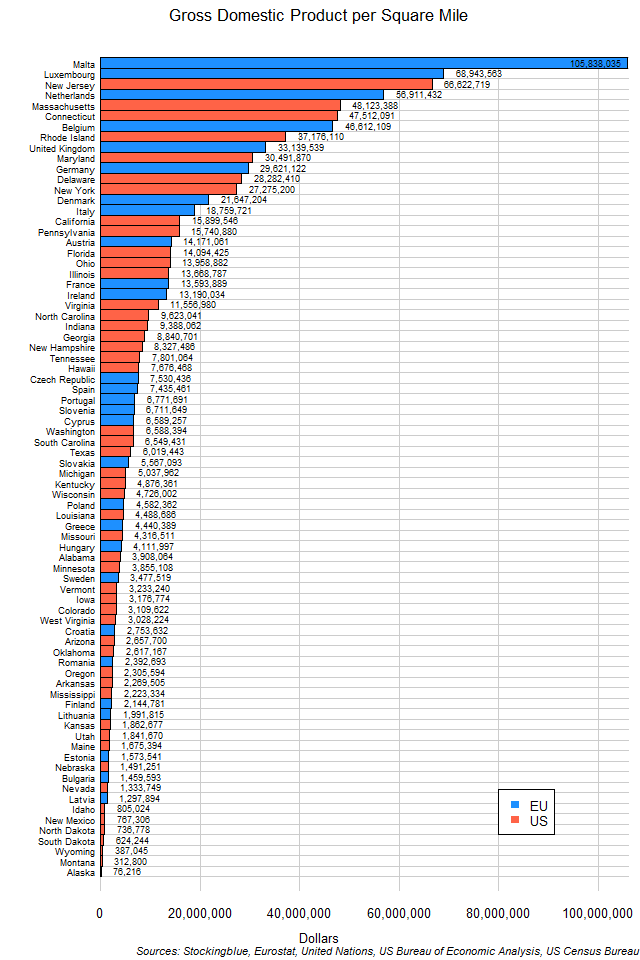
The chart above shows the Purchasing Power Parity Gross Domestic Product (GDP PPP) of EU and US states per square mile of territory in US dollars. EU and US states are distributed pretty much equally in this metric.
Findings
- The difference between the largest GDP PPP per area state, Malta, and the smallest, Alaska, is $105,761,819.
- Malta's GDP PPP per area, is 1,388.66 times larger than Alaska's.
- Both the EU and the US have five economies in the top ten.
- However, eight of the bottom ten are US states.
Caveats
- US area data is from 2010, EU area data is from 2007.
- GDP data for both the EU and the US is from 2016.
- The area includes both land and water area.
- GDP and area data are from different sources.
- EU and US data are from different sources.
- EU data was converted from euros to dollars at the average 2016 0.77 euros to dollars rate.
Details
The majority of states make up at least 75% of the per area GDP of the next largest state with this metric. The only exceptions are Alaska (24% of Montana's per area GDP), Wyoming (62% of South Dakota), Idaho (62% of Latvia), and Luxembourg (65% of Malta).
It should be interesting to see how this data correlates to population density and land values and how just factoring for arable land would change the data.
Sources
Eurostat. 2017. "Gross Domestic Product at Market Prices. Accessed October 26, 2017. http://ec.europa.eu/eurostat/tgm/refreshTableAction.do?tab=table&plugin=1&pcode=tec00001&language=en.
United Nations. 2007. "United Nations Statistics Division - Environment Statistics." Accessed January 23, 2018. https://unstats.un.org/unsd/environment/totalarea.htm.
US Bureau of Economic Analysis. 2017. "Regional Data." Accessed October 26, 2017. https://bea.gov/itable/iTable.cfm?ReqID=70&step=1#reqid=70&step=1&isuri=1.
United States Census Bureau. "Annual Estimates of the Resident Population: April 1, 2010 to July 1, 2016." Accessed December 12, 2017. http://factfinder2.census.gov.