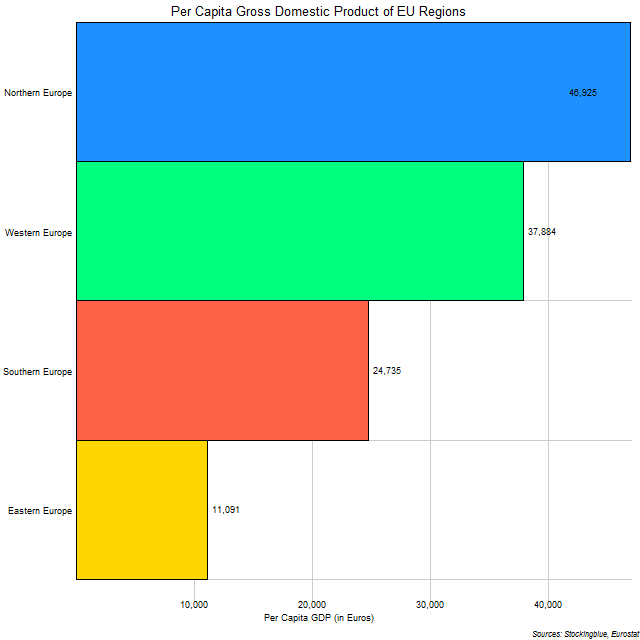
The chart above shows the per capita GDP of EU regions. Although as was shown in a previous report, Northern Europe has the smallest GDP, it does significantly better when GDP is measured on a per capita basis, having the largest of the four main regions.
Findings
- There is a substantial difference in per capita GDP between the regions.
- The ratio of richest EU region to poorest EU region is 4.23.
- The wealthiest region is more than a four times better off than the poorest region.
Caveats
- The data is from 2016.
- Northern Europe consists of (in descending order of GDP) Sweden, Denmark, and Finland.
- Western Europe consists of (in descending order of GDP) Germany, United Kingdom, France, Netherlands, Belgium, Austria, Ireland, and Luxembourg.
- Southern Europe consists of (in descending order of GDP) Italy, Spain, Portugal, Greece, Cyprus, and Malta.
- Eastern Europe consists of (in descending order of GDP) Poland, Czech Republic, Romania, Hungary, Slovakia, Bulgaria, Croatia, Slovenia, Lithuania, Latvia, and Estonia.
Details
Even though Northern Europe has the smallest economy, the limited number of nations and the limited number of people living within them guarantees that the per capita GDP of the region will be high compared to the other regions.
The other three regions drop down a spot each from their GDP rankings.
Sources
Eurostat. 2017. "Data Explorer." Accessed December 11, 2017. http://appsso.eurostat.ec.europa.eu/nui/show.do?dataset=urb_lpop1&lang=en.
Eurostat. 2017. "Gross Domestic Product at Market Prices. Accessed October 26, 2017. http://ec.europa.eu/eurostat/tgm/refreshTableAction.do?tab=table&plugin=1&pcode=tec00001&language=en.